We at Pro Football Focus cover every player on every play of every game at the NFL and major college football level. Our unique coverage of the game of football has developed and built the most comprehensive analysis of the sport in terms of player and team performance. Be it player grades, draft analysis, snap counts, positional rankings or anything in between, PFF has something for every football fan, player, coach, mom, dad or layman.
With our unique way of collecting data for PFF's analysis, our very own signature statistics are recorded and produced. By any combination of the 80-plus data points per play, 300-plus man hours per game or the 70,000-plus hours spent watching one season by our team of analysts, our signature statistics go a long way at explaining player performance on any given play of any given game for any given season.
While our data scientists are studying our signature statistics and play-by-play data for year-to-year stability and much more, and our advanced charting team is deep in the next-level analysis for quarterbacks with our accuracy charting, PFF's signature statistics are here to stay. Some may be relatively self-explanatory but some need a bit of further explanation to the layman or even football's most enthused as to why we track, why they're meaningful, what they mean and/or a combination of the three.
As we look to the 2019 season, this piece is meant to stand as the go-to for any questions you may have as a reader on any of our signature statistics at any point during the off- or in-season.
Quarterback
Adjusted Completion Percentage
PFF's adjusted completion percentage metric is a better way of looking at a quarterback's overall accuracy at it's baseline. While our quarterback analysts are diving into actual accuracy by ball location, route type, depth of target and other factors, adjusted completion percentage is gleaned from our initial data collection of every game. Adjusted completion percentage takes into account factors outside of the quarterback's control in terms of completing passes. It accounts for dropped passes, passes thrown away, spiked balls, passes batted at the line of scrimmage and those passes in which a quarterback was hit as he threw. Ultimately, this gives a real indication of completion percentage on passes that can actually be caught, as opposed to a quarterback's completion percentage for a given game being tarnished by a load of receiver drops or other factors.
Deep Passing
A deep pass by PFF standards is any pass that is targeted and travels at least 20 yards in the air, past the line of scrimmage. We then have a variety of statistics that develop on just these passes such as attempts, completions, drops, yards, touchdowns, interceptions, passer rating, deep pass attempt percentage (amount of deep passes per every pass) and adjusted completion percentage on deep passes.
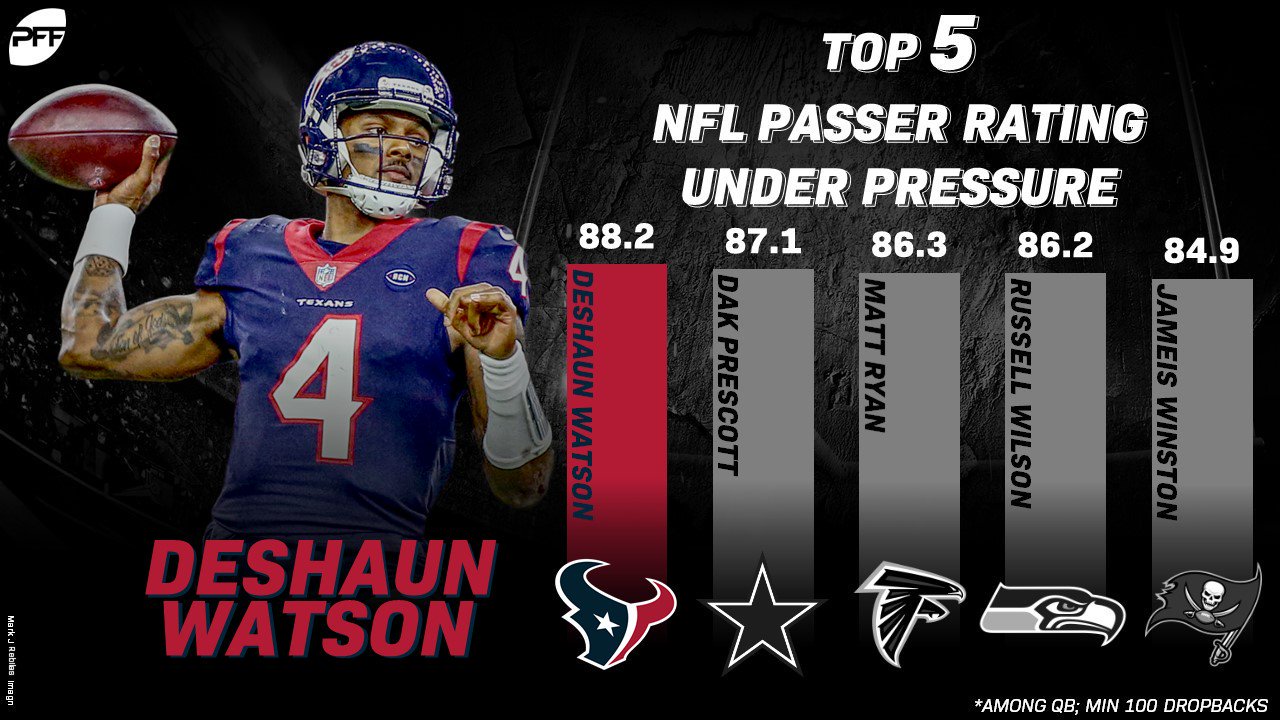
Under Pressure
Dealing with pressure is a huge part of playing quarterback, especially with the pass-rushers in the NFL and college nowadays and the pass-happy nature of the league. Under pressure passing is any time the quarterback is disturbed from his normal throwing motion from set up to release, or anytime a pressure is registered on a given passing play. Much like deep passing statistics, we then develop individual statistics off of just pressured passing. In addition to the usual suspects of yards, completions, attempts, passer rating and adjusted completion percentage, we also have pressure percentage (the amount of times a QB is pressured compared to total dropbacks) and sack percentage (the amount of time when under pressure a QB is sacked).
Kept Clean
Much like how dealing with pressure is a big part of playing quarterback in the NFL, playing from a pocket kept clean from pressure and within the offense's structure is also vital, and proven to be much more stable from a year-to-year standpoint. Kept clean passing is relatively self-explanatory and is simply whenever a quarterback unleashes a pass without pressure being recorded on the play. We also keep track of the amount of time per total dropbacks a quarterback is kept clean as our ‘no pressure percentage' metric.
Play Action
Play action is a major part of the NFL and football in general as it attempts to fool a defense by ‘faking a run play' in attempt to open up passing lanes to different levels of the field. At PFF, we track all play-action passes and all non-play-action passes and craft all of our standard and signature statistics off the backs on whether a quarterback recorded a play fake or not. Unique to just play action passing, we also track the difference in completion percentage on play-action passes to non-play-action passes, showcasing which quarterbacks saw the biggest boost on the back of a play fake.
Time in Pocket
One of the more unique signature statistics at Pro Football Focus, the time in the pocket metric records the amount of time a quarterback takes from snap to throw. We average out the quarterback's time to throw, time to attempt a pass, time until he's sacked and time until a quarterback scrambles. On all passing attempts, we bucket them into quick passes (passes thrown within 2.5 seconds or less of the snap) or longer-developing passes (passes thrown at least 2.6 seconds after the snap). Each type of pass records it's own totals of attempts, completions, yards, touchdowns, interceptions and passer ratings showcasing which quarterbacks utilize a quick delivery best and those who are better than others letting his receivers develop their routes downfield.
Wide Receiver
Wide Receiver Rating
PFF's wide receiver rating is an individualized statistic that plays off the general knowledge of the passer rating statistic. A quarterback receives a passer rating based off a formula of completions, attempts, yards, touchdowns and interceptions – so at PFF with our unique play-by-play data, we take into account those factors for a wide receiver. In turn, whenever a receiver is targeted, his wide receiver rating (or his passer rating when targeted) is generated. The formula takes into account the total targeted passes to one receiver, the amount of receptions, yards, touchdowns and interceptions on those throws, and gives a rating on a scale of 0.0 to 158.3, the higher the rating the better.
Drop Rate
Drop rate is another individualized statistic for receivers (or any pass-catcher for that matter) as it takes into account the amount of catchable targets thrown a receiver's way against the amount of dropped passes on those catchable targets. This isolates the amount of actual passes that could be caught by a receiver, not the amount of total targets, and produces a better mark of how ‘sure' a receiver's hands are a given game, season, career.
Deep Passing
Much like deep passing for a quarterback, deep passing statistics for a receiver are just those passes that are targeted to one receiver and travel at least 20 yards past the line of scrimmage.
Slot Performance
The slot position is any eligible receiver lined up inside the farthest eligible receiver from the ball and outside of the tight end or offensive tackle on the line of scrimmage. One of the most underrated aspects of any given NFL offense, the slot receiver position has become increasingly valuable in today's NFL. At PFF, we track every player's position, on offense and defense, at the time of the snap. From there, we showcase just how many targets, routes, receptions, yards, touchdowns and drops a receiver has from the slot to depict which receivers are best at working from the inside alignment.
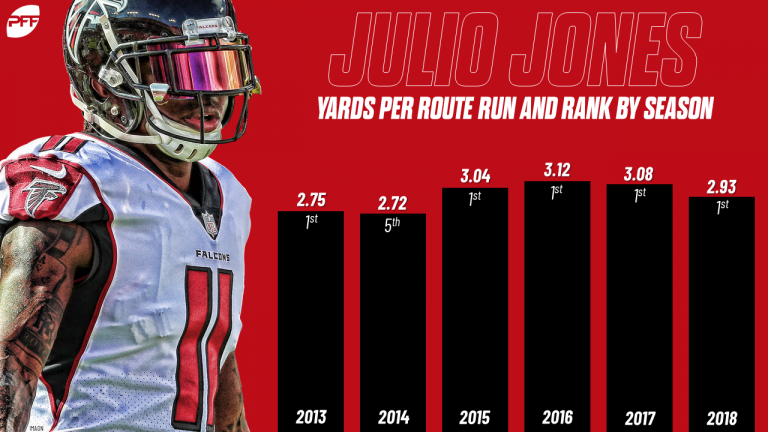
Yards Per Route Run
One of the most widely recognized PFF signature stats, yards per route run takes into account the amount of snaps a receiver runs a route as an eligible receiver against the amount of receiving yards he gains for a particular game or season. This metric identifies those receivers who are game-changers on every snap rather than total receiving yards or total receptions, which may be buoyed by a monster performance such as a 10-catch game or a 200-yard receiving outing.
Running Back
Missed Tackles Forced
Relatively self-explanatory, missed tackles forced examines whether a running back (or any ball carrier) did something to make a would-be sure tackler, miss said tackle.
Elusive Rating
PFF's elusive rating boils down a runner's success past the point of being helped by his blockers. It takes into account yards after contact, missed tackles forced on carries and on receptions to generate a figure that stands the test of just how difficult a running back is to take down.
Breakaway Percentage
Big plays come in chunks at all levels of football and at PFF, we classify any run of 15 or more yards as a breakaway run. Our breakaway percentage figure records the total percentage of yards accumulated on a given season that came by way of these breakaway runs.
Yards Per Route Run
See yards per route run above for full description. This statistic showcases how many times a running back left the backfield as a viable pass-catching option for his quarterback in relation to how many receiving yards he achieved.
Drop Rate
Again, see drop rate for WRs above but this shows how many dropped passes a running back had per the amount of catchable targets thrown his way.
Pass-Blocking Efficiency
Pass-blocking efficiency takes the amount of snaps a running back spent in pass protection against the amount of pressures he allows to create a figure with a maximum value of 100.0 for a perfect, clean slate of pass protection.
Tight End
Pass-Blocking Efficiency
See above for pass-blocking efficiency. Tight ends also have the same signature stats as wide receivers, including slot performance, drop rate, deep passing and yards per route run.
Offensive Line
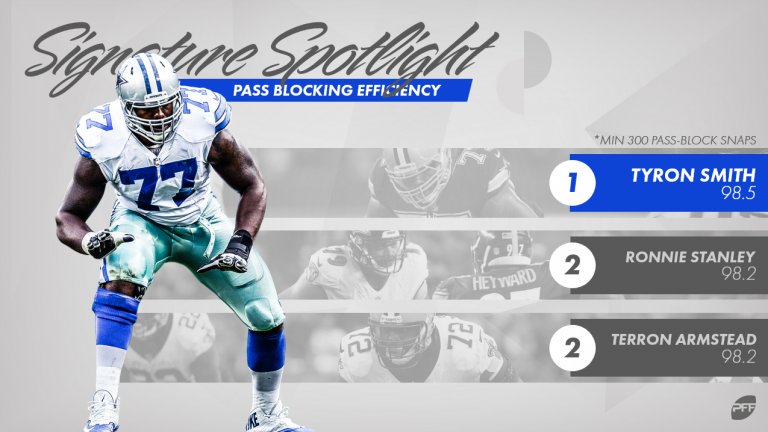
Pass-Blocking Efficiency
To expound further on pass-blocking efficiency more so than above, ‘PBE' measures pressures allowed on a per-snap basis with weighting towards sacks. It's one thing to allow 10 QB pressures over the course of a few games but another task entirely to allow 10 total pressures over the course of a season and PFF's PBE shows just that.
Interior Defensive Linemen
Run-Stop Percentage
Our run-stop percentage figure is the amount of defensive stops a defender makes against the run compared to the amount of snaps he played in run defense. Obviously, a player who has played 400-plus snaps against the run is going to have a gaudy amount of tackle opportunities and similarly, a player with less time spent against the run will have less. Run-stop percentage averages out the amount of stops per snap essentially, giving a true testament of how impactful a player was on a per-play basis.
*Side note: A stop constitutes a ‘win' for the defense or conversely a ‘loss' for the offense. PFF describes a ‘stop' further as an offensive gain on first down that is kept to less than 40 percent of the line to gain, less than 50 percent of the line to gain on second down and any third- or fourth-down play kept without a first down or touchdown.
Pass-Rush Productivity
Generally speaking, the standard in which pass-rushers are held to at PFF outside of their pass-rushing and overall grades is their pass-rush productivity. Defined as the amount of pressure accumulated per pass-rushing snap, like pass-blocking efficiency, PFF's ‘PRP' also gives weighting towards sacks accumulated by a defender. In connection with pass-rush productivity, we at PFF also track the amount of snaps a defender plays against the pass and how many of those were spent as an actual pass-rusher to determine this figure.
Edge Defender (4-3 defensive end)
Pass-Rush Productivity
The 4-3 defensive end is a specific branch of edge defender that typically lines up as a down-lineman on the end of the defensive front. Playing in a 4-3 scheme doesn't change much in terms of the edge defenders role, rather just where they line up to do so and what's happening behind them. Pass-rush productivity is tracked the same way as it is stated above for interior defenders as it is for edge defenders.
Run-Stop Percentage
See interior defender above for run-stop percentage.
Edge Defender (3-4 outside linebacker)
Pass-Rush Productivity
The 3-4 outside linebacker is the other branch of edge defender, again usually split into two categories at the NFL level rather than at the college level. 3-4 outside linebackers typically line up as an off-ball linebacker and not in a three-point stance like their 4-3 edge defender counterparts and are more likely to back into coverage while still also maintaining a high number of pass-rushing snaps. Important when looking at PRP for 3-4 OLBs and 4-3 DEs (both classified as edge defenders) is actually looking at the number of snaps a defender actually rushed the passer. That's where pass-rush productivity comes into play to showcase which players rushed the passer more effectively on a per-play basis.
Run-Stop Percentage
See interior defender above for run-stop percentage.
Tackling Efficiency
Instead of the normal box score tally of total tackles and assists, PFF also tracks missed tackles similar to how we track missed tackles forced. Did a defender miss a would-be sure tackle on a play? Was it against the run or after the catch? Tackling efficiency gives us a figure for both facets on defense as well as a combined number of total tackle attempts by a defender compared to the amount of missed tackles a player recorded over the course of a game or season.
Coverage
With coverage becoming more and more important for a defense, finding talented linebackers who can drop back in coverage is also becoming more important. Our coverage metrics include the amount of snaps in coverage per reception allowed, the amount of snaps per targeted pass and the basics of targeted passes, snaps in coverage, receptions allowed as the primary defender, yards allowed, yards after the catch, touchdowns, interceptions and pass breakups. More on specific types of coverage signature stats below.
Linebacker
Run-Stop Percentage
See above for run-stop percentage.
Pass-Rush Productivity
Typical off-ball linebackers are not going to be regularly tasked with rushing the passer and they should, rightfully so, not be compared to those players who are specifically designed on a per-play basis to rush the passer. While we track blitz percentages and tendencies, we also track how many snaps other players at every other position other than defensive linemen spend rushing the passer. This is an important aspect of any defensive player's ability, depicting just how well they can cause havoc in the backfield when tasked to do so.
Tackling Efficiency
See above for tackling efficiency.
Coverage
See above for coverage in terms of linebackers.
Cornerback
Run-Stop Percentage
We've grown accustomed to seeing linebackers and defensive linemen rack up run-stopping plays in the backfield and those jarring hits that keep offense's off schedule, but what about those cornerbacks who step in to fill against the run? PFF's run-stop percentage among cornerbacks indicates just how well some cornerbacks step up against the run. While some of these specific cornerbacks will be schemed to be closer to the ball at the time of the snap or not is a story in and of itself, run-stop percentage does a great job of showing which cornerbacks were in on a stop against the run regardless of what their job was to do on that given play.
Tackling Efficiency
See above for tackling efficiency description.
Coverage
Obviously, coverage is the primary job of any cornerback in the NFL or at the college level. At PFF, we track every individual alignment pre snap and the amount of targets, receptions allowed, yards allowed, touchdowns and interceptions as well as a variety of different coverage metrics to give an indication of several factors outlined below:
- Cover snaps per target
- With tracking the amount of snaps in coverage by a cornerback, we also generate how many snaps a CB was targeted based off that figure. This showcases potentially how sticky a cornerbacks coverage was.
- Cover snaps per reception allowed
- After snaps per target, we then break it down further by showcasing how many receptions a cornerback allowed per snap he spent in coverage. The higher the number here, the fewer receptions a cornerback allowed per snaps in coverage.
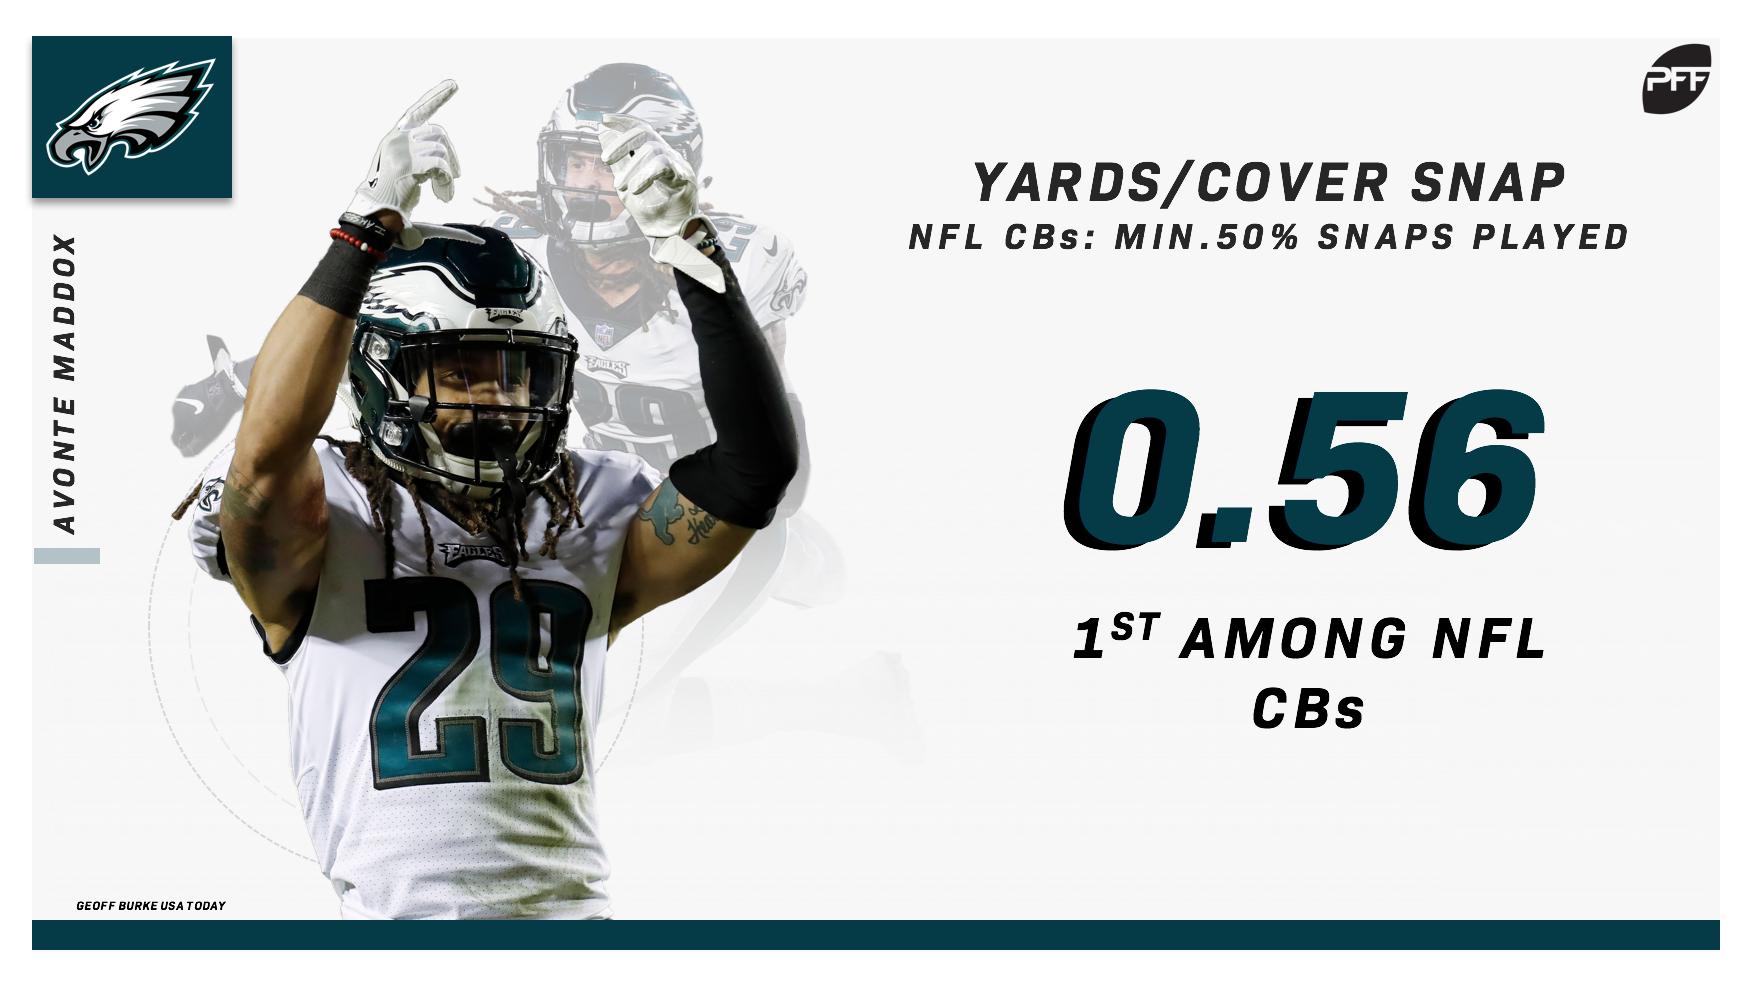
- Yards allowed per coverage snap
- Relatively self-explanatory, this is the amount of yards a cornerback allows per the amount of snaps he plays in coverage and is individual from the amount of coverage snaps per target/per reception.
- Passer rating when targeted
- A true testament of a cornerback's coverage on the whole, this metric utilizes the exact same formula that a quarterback's passer rating uses, but only on throws targeted at a specific player. The lower the passer rating against one specific player, the better coverage he had.
Slot Performance
The above level of detail in terms of coverage is then also transferred over to cornerbacks (or defensive backs in general, could include safeties) who line up in the slot (see above for slot definition).
Pass-Rushing Productivity
Not at all a primary job of any defensive back, cornerbacks who can blitz really round out their game and when tasked to do so, PFF's PRP for cornerbacks showcases those who really got home when attempting to rush the passer.
Safety
Run-Stop Percentage (in the box)
While run-stop percentage has been outlined ad nauseam here in this piece, we take it a step further for safeties. With our play-by-play charting and player participation collection, we track every player's alignment pre snap. That includes safeties and the depth at which they start the play. Those players who are within eight yards of the line of scrimmage at the time of the snap are considered to play ‘in the box.' Our run-stop percentage for safeties showcases just that, how many stops a safety made when he was lined up in the box and how many he made when he was outside of the box.
Tackling Efficiency
See above for tackling efficiency.
Coverage
The same coverage metrics outlined above are also given to safeties when they are the primary defender in coverage, either pre-snap or post snap after the coverage adjusts per scheme.
Pass-Rushing Productivity
See cornerback description for pass-rush productivity.
All of PFF's Signature Stats are available in Premium Stats. Join PFF ELITE and get full access to Premium Stats and more.

