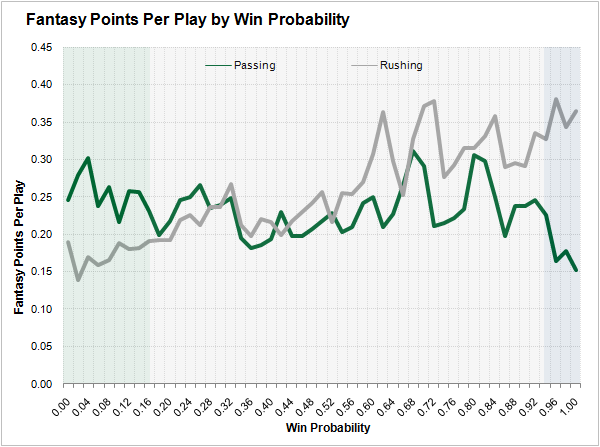
In my previous article, I created a formal definition for garbage and counter-garbage (CG) time based on team win probability. I called it the former when a team has a 16 percent chance to win the game or less, and I called it the latter when a team has a 94 percent chance to win the game or greater. Each of those situations impacts a player’s fantasy expectations, which you can see in the green (garbage) and blue (CG) zones on the following chart of passing and rushing fantasy points per play.
Even though I selected fairly narrow win probability bands for garbage and CG time, it turns out that players can experience vastly different ratios of plays in them in a given season. Let’s focus on 2016, since last year serves as the primary basis for most fantasy draft decisions right now. Among quarterbacks with at least 200 pass attempts last season, the ones who threw the highest percentage of their throws in garbage time tended to be on the worst teams.
DOMINATE FANTASY FOOTBALL & BETTING WITH AI-POWERED DATA & TOOLS TRUSTED BY ALL 32
 Unlimited Fantasy League Sync
Fantasy Start/Sit Line-Up Optimizer & Waiver Wire
WR-CB & OL-DL Matchups, PFF Player Grades, & Premium Stats 2.0 Tools
Nathan Jahnkes Rankings - #1 Most Accurate Last 70 Weeks
PFF Best Bets, Player Props, & Power Ranking Tools
NFL Mock Draft Sim with Trades & Draft Grades
Unlimited Fantasy League Sync
Fantasy Start/Sit Line-Up Optimizer & Waiver Wire
WR-CB & OL-DL Matchups, PFF Player Grades, & Premium Stats 2.0 Tools
Nathan Jahnkes Rankings - #1 Most Accurate Last 70 Weeks
PFF Best Bets, Player Props, & Power Ranking Tools
NFL Mock Draft Sim with Trades & Draft Grades
Already have a subscription? Log In

