• Building a more specific look at a popular metric in yards per target: When adjusting for depth of target, field position and alignment, how does this year’s wide receiver class improve (or not) upon their actual yards per target metric?
• See where this year’s top wide receiver prospects land: Marvin Harrison Jr., Malik Nabers, and Rome Odunze are highlighted throughout.
• Try PFF's Mock Draft Simulator: You can trade picks and players and draft for your favorite NFL team.
Estimated Reading Time: 5 minutes
Click here for more draft tools:
2024 Mock Draft Simulator | 2024 Big Board | 2024 Draft Guide
2024 Player Profiles | 2024 Mock Drafts | NCAA Premium Stats
Yards per target (YPT) is a popular metric used in receiver evaluation to determine how efficient each player has been with their opportunities, and while it’s not as strong as yards per route run, it can be an effective way to evaluate how efficient players were with their targets.
Yards per target over expectation (YPTOE), also known as depth-adjusted yards per target, is a metric where full credit goes to FantasyPoints.com‘s Scott Barrett, who discovered a much better correlation year-over-year than just using actual yards per target. Scott’s work on this subject can be found here in article form, and recent YPTOE findings on past rookie wide receiver classes can be found here.
It’s also worth noting that not one metric should be used to evaluate an individual player but instead be used as a single piece to a much larger puzzle, which when combined with other key metrics, help deliver a clearer evaluation of each prospect. Thanks to Scott’s earlier work in determining a stronger correlation than actual yards per target, YPTOE can be used as one of those puzzle pieces.
Utilizing Scott’s work and PFF’s expansive database, we can utilize multiple key isolating factors in order to calculate the YPTOE for this year’s rookie wide receiver class in order to find a clearer representation of how effective each wide receiver has been with their opportunities.
- The first factor is field position of the wide receiver’s offense. The reason for this is that the further away from the opposing end zone an offense is, the more potential receiving yardage there is to gain per target, and the closer the offense is to the opposing endzone, there is less receiving yardage to gain per target. This helps level the yards per target more for those who saw a much higher percentage of red zone targets, for example, with averages highlighted below.
| Field Position | Average Yards per Target |
| Own half (1-50) | 10.1 |
| Opponent’s 49-21 | 9.8 |
| Opponent’s 20-11 | 5.9 |
| Opponent’s 10-5 | 3.5 |
| Opponent’s 4-goalline | 1.5 |
- Another factor taken into account was the actual depth of each individual target at various points on the field. The reason for this is that depending on the depth of the target, whether it’s behind the line of scrimmage, the intermediate areas of the field or deep, the target depth changes the amount of yardage that the target is potentially worth, as highlighted below.
| Depth of Target | Average Yards per Target |
| Behind the line of scrimmage ADoT | 4.2 |
| 1-5 ADoT | 3.8 |
| 6-10 ADoT | 5.5 |
| 11-15 ADoT | 7.4 |
| 16-19 ADoT | 8.8 |
| 20+ ADoT | 11.7 |
- The last key factor taken into account combines both of the above factors to where the wide receiver lined up within the team’s offensive formation. Whether it was wide, in the slot, in-line, or in the backfield, there was a difference, albeit slighter, on expected yardage per target as well.
- The focus is on wide receivers from Power Five conferences to eliminate some of the noise that comes with competition level.

Leaders in actual yards per target
Before diving into how each 2024 rookie wide receiver’s career yards per target changed after using the YPTOE formula, this is where they stand as far as their actual yards per target. Highlighted are players with expected draft capital within the first two days of the NFL draft.
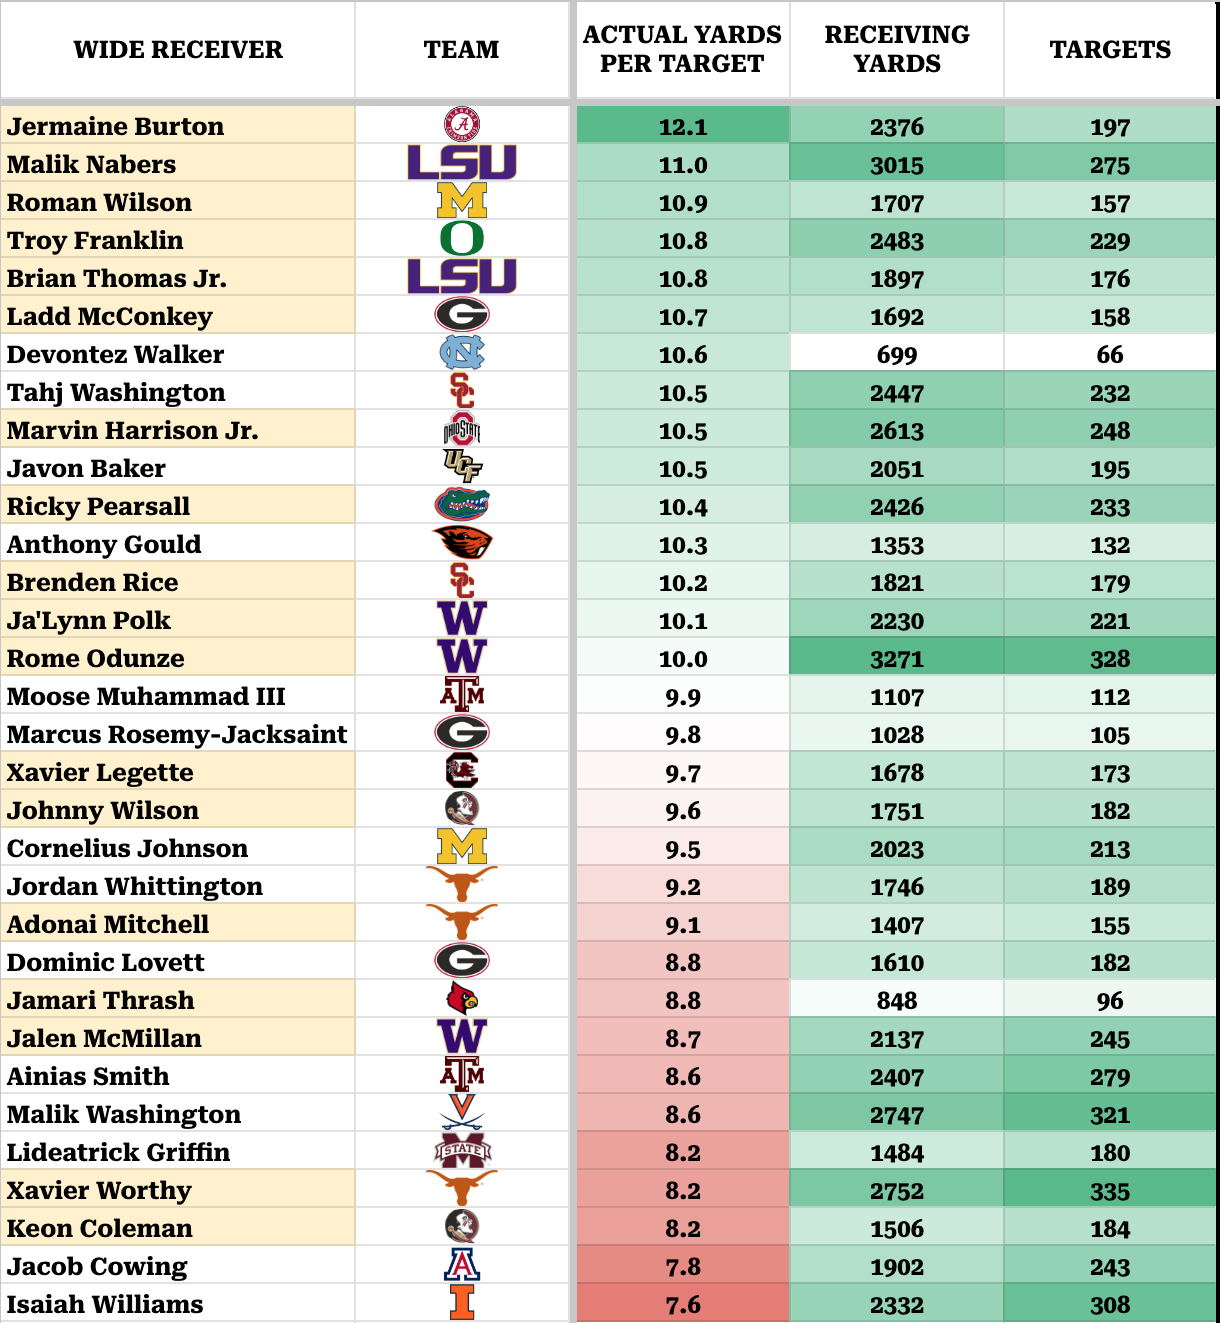
- Leading the way is Alabama’s Jermaine Burton, who is also one of the leaders in career average depth of target for this class (16.8).
- Other leaders in both actual yards per target and average depth of target include Roman Wilson (14.1-yard career ADoT) and Devontez Walker (18.2-yard career ADoT).
- Top-three wide receiver prospects Marvin Harrison Jr. and Rome Odunze both saw a high rate of red zone targets (highlighted here) yet above-average depth of targets in their college careers, so it will be interesting to see if YPTOE can identify if they improve their actual YPT rank at all.
Leaders in yards per target over expectation
Once applying the formula to the entire draft class for their careers, this is how each wide receiver fared in terms of YPTOE, ranked from best to worst over expectations. Highlighted are players with expected draft capital within the first two days of the NFL draft.
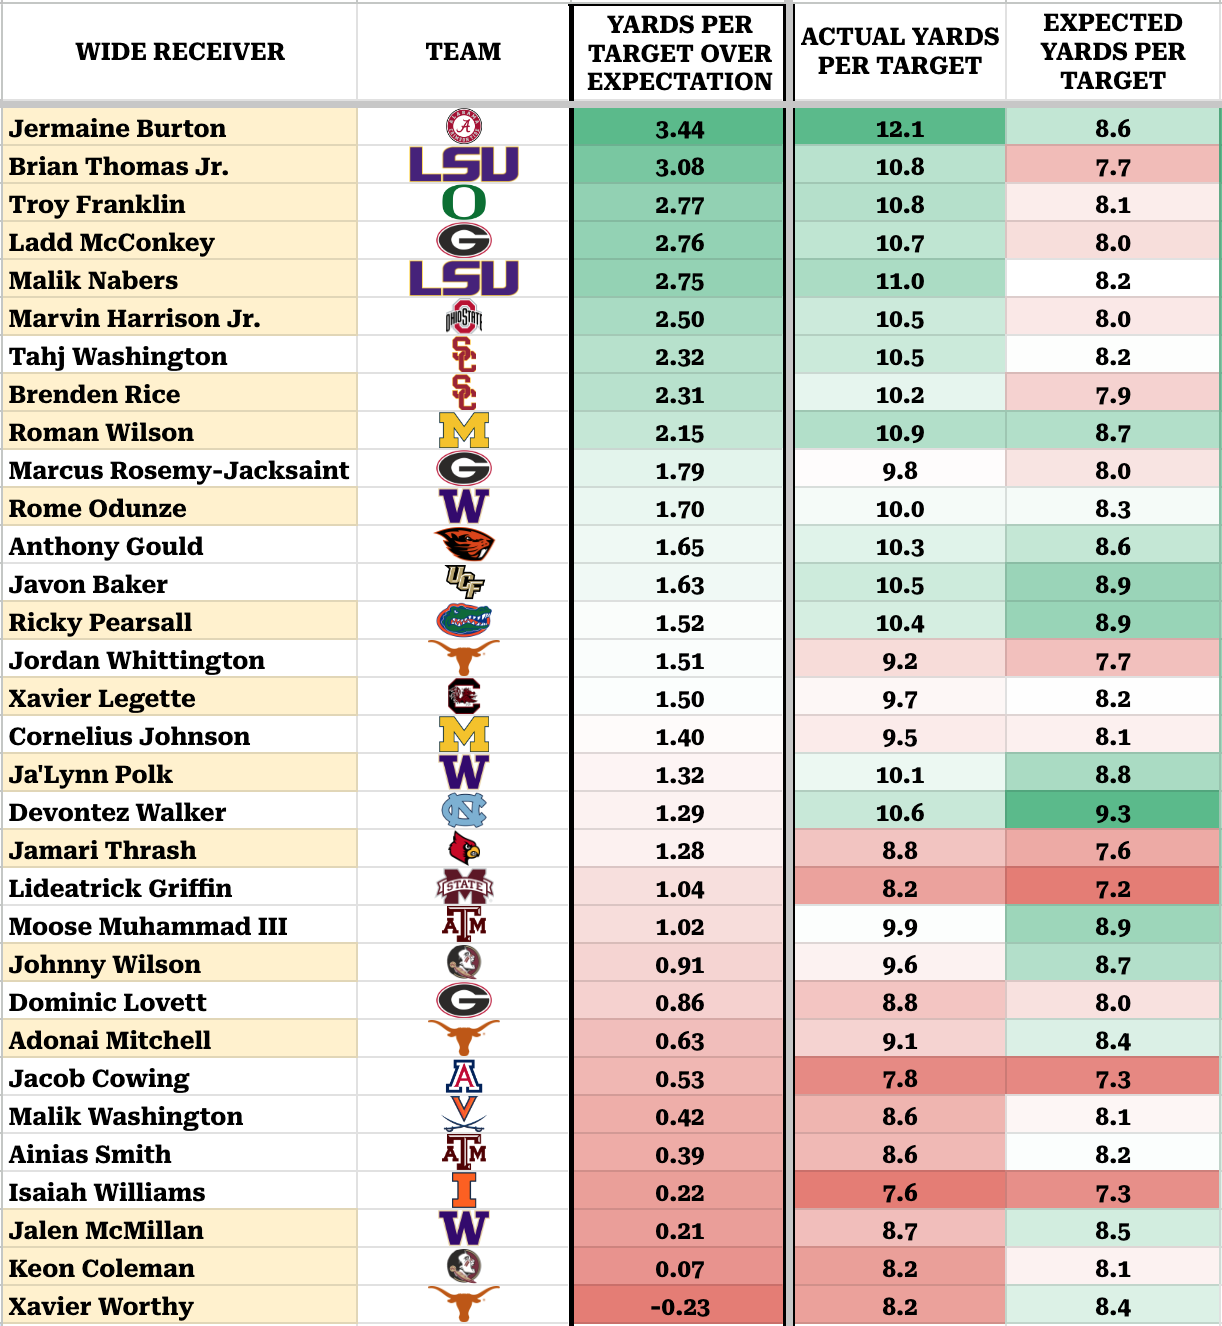
- Alabama’s Jermaine Burton remains at the top, showcasing that his high yards per target figure was no fluke, and while he did have a higher average depth of target, which typically leads to higher yards per target numbers, he still delivered well over expectation thanks to a high overall catchable target rate (92.3%) despite seeing lower percentage completion targets with that high ADoT.
- Brian Thomas Jr. also shows out here, even slightly improving on his actual yards per target ranking, which is a positive sign for a player who rarely leads any analytical metrics coming out of college. His sample size is smaller as a one-year starter, but a positive sign nonetheless, similar to Burton.
- Marvin Harrison Jr. and Rome Odunze also improved their overall rankings from actual YPT to where they ranked in delivering YPTOE. For Harrison, when considering that he isn’t known for his after-the-catch numbers, his ability to even jump slightly in the YPTOE ranks is a testament to how effective he is with his opportunities.
- Xavier Worthy is the only wide receiver to fall below his expected yards per target figure, as he under-delivered based on his usage. Worthy saw a lot of high-value deep targets, combined with high-percentage completion targets around the line of scrimmage, like screen passes (highlighted here). His inability to take advantage of those opportunities can be viewed as a red flag in his data profile.
- Other top names like Malik Nabers, Troy Franklin and Ladd McConkey continue to add to their strong data profiles by appearing among the top performers in this metric, as they have in so many others for their career.
Top risers in actual yards per target versus yards per target over expectation rankings
Here is the full list of players who improved their rankings from actual yards per target to their ranking in yards per target over expectations. Highlighted are players with expected draft capital within the first two days of the NFL draft.
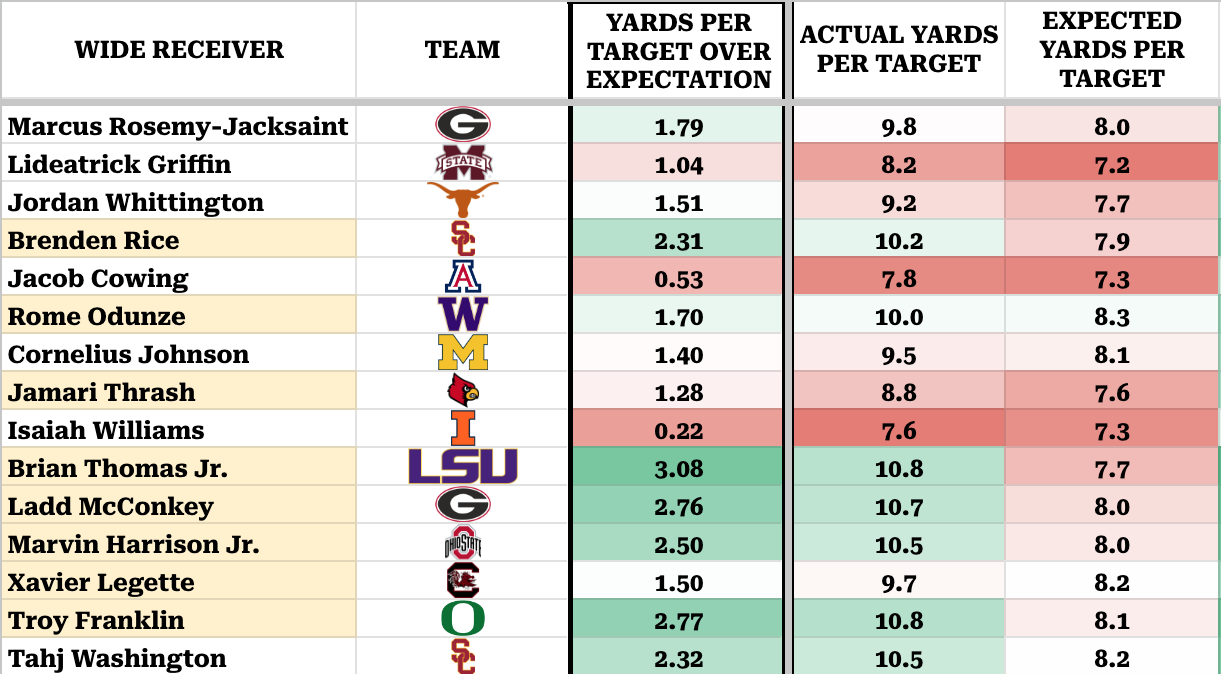
- USC’s Brenden Rice saw one of the bigger leaps using this metric, going from the 13th-ranked player in actual yards per target to inside the top-10 (eighth) in how much he delivered over expectations at plus-2.31 YPTOE.
- Odunze’s leap pushed him from 15th in yards per target to 11th using the adjusted model. A positive sign for a potential top-three wide receiver in this year’s class.
- Jamari Thrash went from 23rd in YPT to 20th in YPTOE.
- Thomas, as highlighted earlier, improved from fourth in yards per target to second in YPTOE.
- Both McConkey and Harrison each jumped two ranking spots as well with McConkey going from sixth to fourth and Harrison going from eighth to sixth.
- Oregon’s Franklin moves just one spot from fourth in YPT to third in YPTOE.
Top fallers in actual yards per target versus yards per target over expectation rankings
Lastly, the full list of players who fell in their rankings from actual yards per target to their ranking in yards per target over expectations. Highlighted are players with expected draft capital within the first two days of the NFL draft.
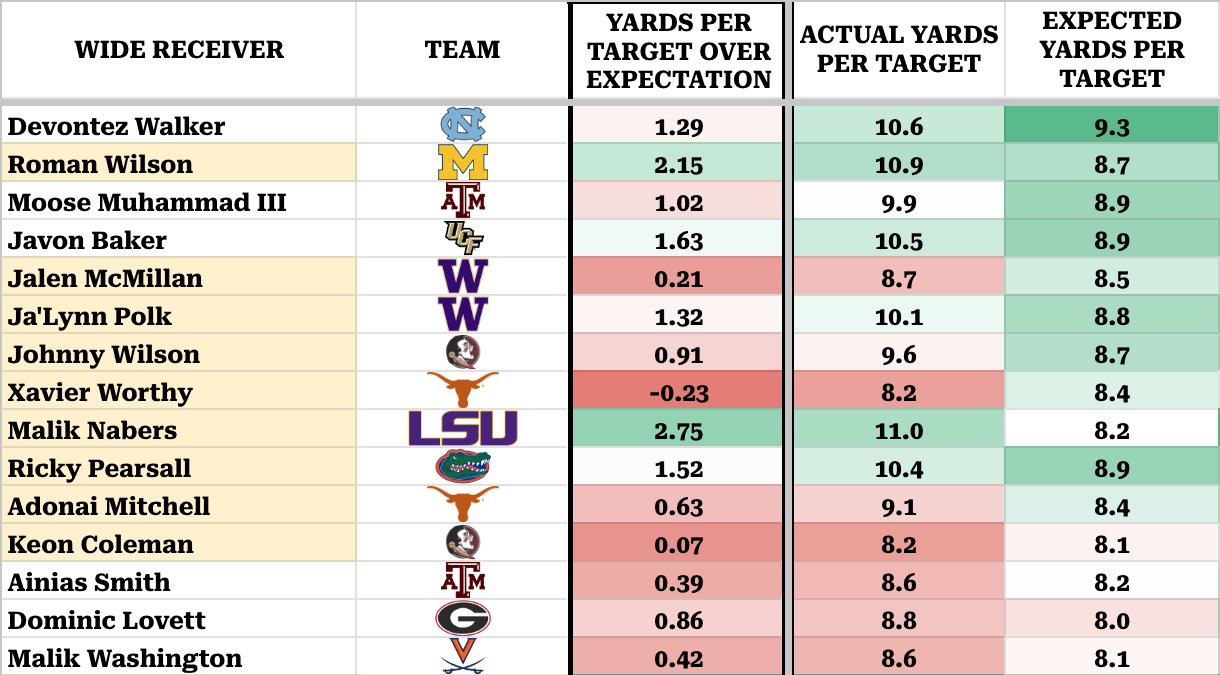
- Michigan’s Roman Wilson performed well in both yards per target and how he delivered over expectations. However, his actual yards per target ranking of third-best in this class comes down to ninth when incorporating this YPTOE model.
- To go along with Xavier Worthy, who was already highlighted early, more potential red flag players include Washington’s Jalen McMillan, Texas’s Adonai Mitchell and Florida State’s Keon Coleman, who already didn’t crack the top-20 among this class’ Power Five wide receivers in yards per target, and actually dropped in their deviation rank with an inability to deliver more than their expectations relative to their peers.
- Ja’Lynn Polk dropped from 14th in YPT to 18th in YPTOE while FSU’s Johnny Wilson also dropped four spots, going from 19th in YPT to 23rd in YPTOE.
- Malik Nabers did fall in his actual yards per target rank compared to YPTOE, going from second to fourth in that regard, though not a concern considering it’s still a top-five number in this class.

