 This article was written in tandem with Ryan McGlothlin, who has spent the past two years developing a system for evaluating which NFL Draft Combine (and pro day) data most effectively predicts a player’s likelihood of NFL success.
We compete in a tough dynasty league – 16 teams, 45-player (plus five on a taxi squad) rosters, full IDP plus kicker/punter, multi-year contracts, a free agent auction and a rookie draft – and perhaps the most important predictor of success is how well owners do in the annual rookie player draft. It’s a five-round affair (80 players selected), and even deep prospect players at premium positions like RB or WR get drafted. This places a premium on owners being able to really figure out which later round (or even undrafted free agent) players may just be the next Alfred Morris, Marques Colston or (you should be so lucky) Arian Foster.
To help our own dynasty drafting and to satisfy some personal curiosity, we have compiled a database of all offensive and defensive positions of importance to dynasty fantasy football that includes the following key data:
1) Player draft position by round and overall #
2) Player Combine and/or Pro Day statistics (sources: NFLDraftScout.com or NFLcombineresults.com)
3) Player Career Approximate Value (CarAV), number of years played and number of years as a starter (source: pro-football-reference.com)
Using this data we have used statistics to answer the following questions:
1) Do Combine and Pro Day scores actually matter and if so, which ones for which positions?
2) What is a better predictor of future success in the NFL: draft position, Combine scores or a combination of the two?
3) Can we use Combine scores to help avoid draft busts or pick potential winners from late round/UDFA players?
The data set we’ve used here is from 1999-2012. 1999 was the first year that Combine data became publicly available (so far as we are aware). Given that this is a relatively short time period, it means that the data analysis is not super-robust statistically and therefore needs to be taken with a grain of salt. However, as time passes and more players have full careers in the database, then we should see the usefulness of the data increase.
We have also broken the data set into positional sub-categories that are relevant for fantasy football. For example, within the linebacker group, there are some who are clearly drafted to be middle linebackers (MLBs) or 3-4 inside linebackers (ILBs) while others are going to be 4-3 outside linebackers (4-3 OLBs) and still others will be “rush” 3-4 outside linebackers (3-4 OLBs) or 4-3 defensive ends . It matters a lot to fantasy players what kind of LB they are drafting. For example, you typically want to avoid those destined to be 4-3 strong side linebackers as these players don’t rack up sacks or tackles in most defensive schemes.
For this first article, we are going to focus on the MLB/ILB group as they are generally high value in fantasy football for those that use individual defensive player scoring. Solid three-down ILBs can be as valuable as RBs or WRs in many leagues.
When drafting a player, you are at minimum trying to identify those that are going to start (though maybe not as a rookie), stay on the field and have a long career. The Career Approximate Value (CarAV) metric developed by Pro Football Reference does a good job of capturing the productivity of players through their careers and is also well-correlated with success in most fantasy scoring systems. A player with a high CarAV for a particular year was also probably highly rated as a fantasy player in that year.
The NFL Draft, for most position groups, is about 50 percent correlated with players’ ultimate success on the field, as measured by CarAV. This means that where a player is drafted (or not drafted) explains about 50 percent of the variance in CarAV from one player to another. This is actually a pretty high correlation and means that, from a fantasy player’s perspective, where a player is drafted will have a big impact on that player’s ultimate success. This correlation does, however, vary a lot between different position groups.
Pretty obvious stuff so far – most fantasy dynasty drafts roughly follow the order in which players were drafted at particular positions.
But is there a way of significantly improving your odds of drafting good players for your fantasy team by going beyond where they were drafted? Specifically, do the various Combine and Pro Day performance metrics provide useful information that we can exploit? For example, can we use this to pick up a player that might not have been highly drafted or avoid a highly drafted player that might have a higher than normal propensity to be a bust?
The ILB position group CarAV performance is 63 percent correlated (with an R-squared of .4) with a player’s draft position (and including UDFAs), which is higher than that of the average player drafted. So the draft is already a better predictor of success for this position group than for others.
The distribution looks like this:

The X-axis is player draft position and the Y-axis is the players CarAV divided by number of years in the league. Higher is better.
We have (somewhat arbitrarily) chosen to use 300 as the draft position for UDFAs, hence the cluster of them at this point. The draft typically ends with 250-260 players selected. This number varies from year to year due to compensatory picks. This doesn’t change the results of the analysis much, as we get similar statistics when we exclude UDFAs altogether (statistics Ph.D.s out there who read this, please feel free to suggest improvements in the comments below).
We then looked at Combine metrics in a variety of ways to see if certain scores (and score combinations) helped predict NFL success better than others. They do. The simple, and much-maligned, 40-yard-dash time had the single highest correlation with success at 42 percent. Adjusting the 40-time to the weight of the player has a 32 percent correlation, 40-time divided by shuttle time (a measure of quick vs. fast and something we term the “Welker,” as Wes Welker scores abnormally high on this metric) comes in at 28 percent, vertical leap at 25 percent and the combined shuttle/3-cone at 18 percent. When you combine these metrics together, you come up with a predictive value with a 50 percent correlation (.24 R-Squared). We term this measurement the Success Prediction Score or SPS.
But what is the point of constructing an algorithm that has less predictive value than just following the order in which players were drafted in the real NFL draft?
The key here is that the SPS-only approach provides a significantly different ranking to draft order alone. By combining the two, you get something better than either on its own. In fact, when we combine these statistics, we get correlation of 70 percent and an R-squared of over .46.
This looks like the below:

Here the X-axis is the Combine metric score assigned to the player minus the draft round they fell in (with an “8” assigned to the UDFAs) multiplied by 12. For example, Patrick Willis has the highest SPS and the highest annual average CarAV (on this basis he is well on track for the Hall of Fame). His SPS unadjusted for his draft position was 32 and his draft-adjusted score was 19 (he was reduced by 12 points as he was a first-rounder). The median unadjusted SPS is -0.5 with a high of 32 and a low of -29. Compare Willis to the player with the second-highest annual CarAV score, his teammate Navorro Bowman. Bowman had a relatively high unadjusted SPS of 5, but was drafted in the third round, which knocked him down to a -31 on draft-adjusted SPS. Bowman has outperformed his draft position and his unadjusted SPS – perhaps because he plays alongside Willis?
Another outlier is the undrafted Vontaze Burfict. All of his combine measurables would have told you to 1) expect him to be undrafted and 2) expect that he would have limited, if any, success in the NFL. He scored a -22 on the unadjusted SPS metric and a -118 adjusted. Only two players in the database, Courtney Ledyard and Jamel Smith, neither of whom were drafted nor even played in the NFL, scored worse in the database. Despite this, Burfict went on to have a very strong rookie season for the Bengals and could have a great career. He is grouped with the ILBs as his build is typical of the position and he went through the Combine as an ILB, though he is currently playing as a 4-3 OLB. Burfict did have a lot of extenuating circumstances around his Combine and Pro Day showings and could possibly be a much better athlete than he showed then. But this is a great example of why it is not sensible to rely only on a metric such as SPS to draft players, whether in real life or fantasy.
The Success Prediction Score should be seen as just another, potentially useful, method of evaluating players on draft day. It could help you identify positive outliers, such as seventh rounder Jamar Chaney, who has ended up with extensive playing time for Philadelphia and who has the fourth-highest draft-unadjusted SPS in the database. It could also help you avoid busts such as third rounder Anthony Schlegel, drafted by the Jets in 2006. His unadjusted SPS of -7 places him in the same region as many undrafted and sixth- or seventh-round players. Rob Morris, a 2000 first-round draft pick by Indianapolis, is another example. Morris had a very average unadjusted SPS of 0.35 (-0.5 is median). While he lasted eight years in the league, he never produced at a level commensurate with his draft position (at least as measured by CarAV). Beware of highly drafted players with average or below-average SPS.
So finally, we turn to the 2013 ILB class to see what we might have here. Below are the ILB class members for which we have good Combine/Pro Day data:
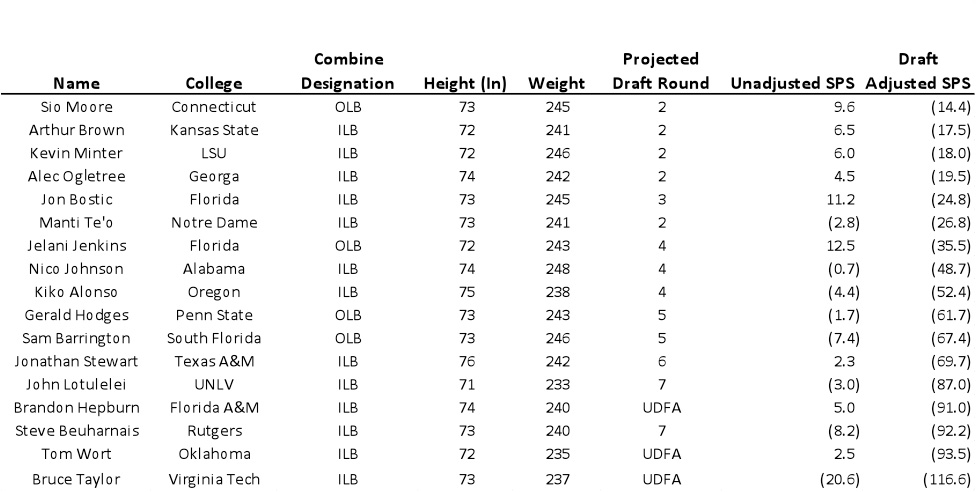
We do not have good data for Kevin Reddick, Michael Mauti or A.J. Klein and so exclude them from this analysis. We have added some players to this list, such as Sio Moore and Jelani Jenkins, who went to the combine as OLBs, but whose physical characteristics are much more consistent with an ILB (between 230-260 pounds and 6’3” and shorter).
The 2012 draft was an exceptionally good one for ILBs, with several having significant impact in their rookie seasons such as Bobby Wagner, Zach Brown and Mychal Kendricks. It is not a coincidence (to me anyway) that these three players also all rank in the top five all time in unadjusted SPS alongside players like Willis and Brian Urlacher. In 2013, no players rank so highly, but both Jon Bostic and Jelani Jenkins have top-20 all-time unadjusted SPS scores of 11.2 and 12.5, respectively.
If they all end up being taken by at least the second round as is currently projected, Sio Moore, Arthur Brown, Kevin Minter and Alec Ogletree all have adjusted SPS scores that are also consistent with success. Manti Te’o is a player with a red flag using SPS. He has a below-average unadjusted SPS score, but could still be highly drafted. None of the other players look to be particularly exceptional either way, though Brandon Hepburn is a player that you might keep an eye on as he appears to have the requisite athletic tools for success with an above-average unadjusted SPS of 5. Conversely, Sam Barrington may be over-drafted even in the fifth round given his below-average athletic tools.
