 As we wade into our massive pool of College Football Focus data, we’ll be sharing with you some of the highlights from our Signature Stats in position-by-position looks. So, over the next couple weeks you can expect daily dives into the best and worst that the full FBS schedule produced in all of the same categories you’ve come to know from our NFL coverage. It’s important to note that our stats are different from our grades, as the stats are black and white, result-based numbers while the grades add the context to a player’s contribution in each situation.
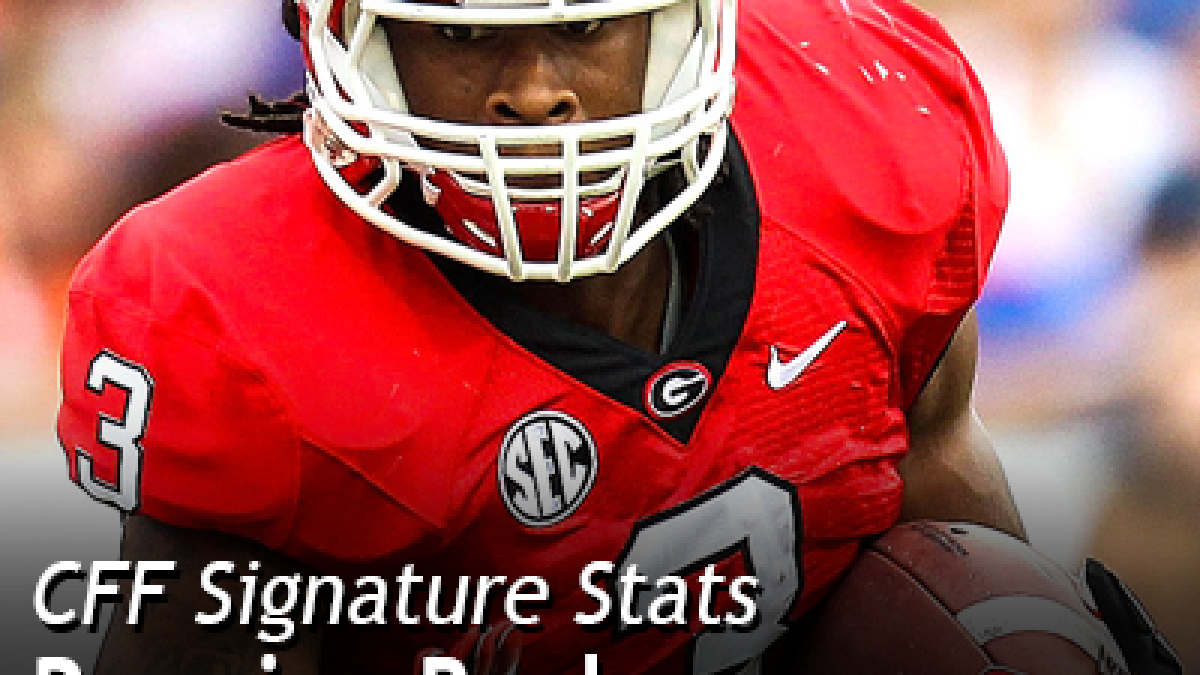
Here is a look at some of our more overall and rushing-based signature stats for running backs with the 2014 NFL leader listed for perspective.
Elusive Rating

2014 NFL Leader: Marshawn Lynch 94.3
Our Elusive Rating statistic attempts to measure the success of a running back beyond his blockers by taking missed tackles forced and yards after contact into account against the player’s total touches. Our grades take into account things that normal statistics cannot, such as a burst of speed that beats a defender without providing the defender an opportunity to make a tackle, and therefore won’t match up exactly with Elusive Rating, but the rating has still proven to be a good representation overall.
– Between suspension and injury, Todd Gurley missed a significant portion of the season. However, he was one of the most explosive runners when he was on the field. To provide some more context to Gurley’s 116.6 rating, there have only been two players in eight years of PFF NFL data to break a 90 score in the regular season (Marshawn Lynch, 2014 and C.J. Spiller, 2012). Even with Lynch’s outstanding performance in the playoffs last year, he still only reached a 104.2 Elusive Rating.
– You don’t see Josh Robinson talked about often among draft prospects, but he is one of the better backs at making defenders miss at the second level with his excellent lateral agility. His 3.96 rush attempts per missed tackle forced is the second-best rate among Power 5 running backs with at least 100 carries in this draft class.
– Unsurprisingly, Melvin Gordon makes the Top 10 after leading the draft class with 78 missed tackles forced. Tevin Coleman also made the list while being the only back in the class to average over four yards after contact per rush.
Elusive Rating Versus Power 5 Opponents

There is obviously a wider range of competition levels in college compared to the NFL. One of the things we can do with our database is narrow down players’ performance against specific conferences. In this case, we are looking solely at the Power 5 conferences to analyze how the players performed against (generally) better competition.
– While most backs had at least a slight drop in Elusive Rating, T.J. Yeldon generally fared better in games versus Power 5 teams compared to his brief showings against Florida Atlantic and Southern Miss.
– One of the biggest drops among the top backs was Coleman, who dropped to a 51.1 rating. Of his 50 missed tackles forced on the year, 22 came against non-Power 5 opponents which accounted for only 23% of his carries.
– Former Hurricanes running back Duke Johnson jumps into the Top 10 along with his FBS-leading 13 missed tackles on pass receptions.
Breakaway Percentage

2014 NFL Leader: Justin Forsett 41.7%
Our Breakaway Percentage signature stat shows which running backs earn the highest percentage of yardage on runs of 15-plus yards.
– Coleman showed a knack for evading safeties and the ability to break off large chunks of yardage this season, and eclipsed 1,000 yards on big plays alone.
– Gordon gained 1,469 rushing yards on his FBS-best 40 runs of 15-plus yards, which would have ranked 10th in rushing yards among the draft class based on just those 40 carries.
Breakaway Percentage Versus Power 5 Opponents

When looking at games against Power 5 opponents, there is surprisingly not a large change in Breakaway Percentage.
– While Coleman and Gordon’s respective Breakaway Percentages changed by only a little more than one percent, each had eight of their 15-plus yard runs against non-Power 5 opponents.
– This may say more about Big Ten run defenses, but six of the Top 10 players came from the conference, compared to just two from the SEC and two from the ACC.
Follow Matt on Twitter: @PFF_Matt
![]()
