Yards per carry is one of the most commonly referenced statistics when looking at a running back’s efficiency. Despite its popularity, and despite using it quite often myself, I loathe the statistic. It’s inherently biased, favoring running backs with great offensive lines, running backs who see a high percentage of carries against poor run defenses, running backs who see a high percentage of carries on likely passing downs, or running backs who might be inconsistent but compile a high percentage of their yardage on relatively few carries. Like all statistics, it’s one that’s much better served when looking at it with more context, and that’s what I’m hoping to do here today.
Pro Football Focus helped revolutionize how we look at running back efficiency by creating the “elusive rating” metric. This statistic helps “distill the impact of a runner independently of the blocking in front of him by looking at how hard he was to tackle.” The focus here is on yards after contact per attempt and missed tackles forced per attempt, rather than raw yardage totals. Jay Ajayi dominated this statistic last season, leading the league in yards after contact per attempt and missed tackles forced per attempt.
Yards before contact per attempt
Another way of measuring how effective each running back was on their own versus how much help he received from his offensive line is by looking at a team’s yards before contact per attempt average. Here’s how each team fared in 2016.
Yards before contact per attempt by offensive line in 2016: pic.twitter.com/MpGBQtJmXp
— Jeff Ratcliffe (@JeffRatcliffe) March 13, 2017
Among all running backs with at least 100 carries, Buffalo’s Mike Gillislee led the league in yards per carry and LeSean McCoy ranked third. Gillislee’s 2016 season actually ranked 13th-best among all running backs with at least 100 carries in any season since the NFL merger in 1970. Those are impressive numbers, but they both benefited from strong offensive line play that gave both runners substantial room when handed the ball. When looking at how little room Ajayi was given, it can be argued his season was even more impressive. Lamar Miller’s disappointing season looks even less impressive when factoring in the effectiveness of his offensive line. This isn’t a perfect statistic, as some running backs are more patient or slower out of the gates than others (and this can make an offensive line’s yards before contact numbers look worse), but it does help give context.
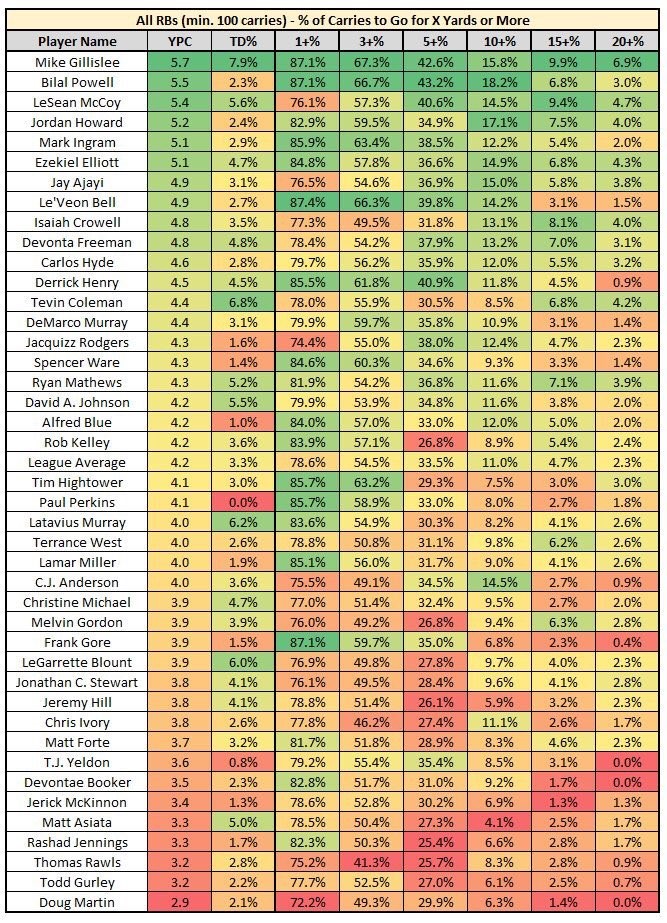
Yards per carry by run length
The next chart we’ll look at is sorted by a running back’s yards-per-carry average, but breaks it down by what percentage of runs went for 1 or more yards, 3 or more yards, 5 or more yards, etc. This helps show consistency. Mark Ingram stands out as a running back who, though he may have lacked big-play upside, was consistently getting positive chunk yardage. Isaiah Crowell was someone who stood out as being overly reliant on big plays. A whopping 37 percent of his total rushing yardage came on just five percent of his carries.
Yards per carry compared to teammates
Another way of breaking down yards per carry is by looking at how different running backs fared when compared to their teammates. Though different running backs are used in disparate ways even on the same team, they are likely running behind the same offensive line and are taking handoffs from the same quarterback. Here are the running backs (min. 50 rushing attempts) who stood out compared to their peers.
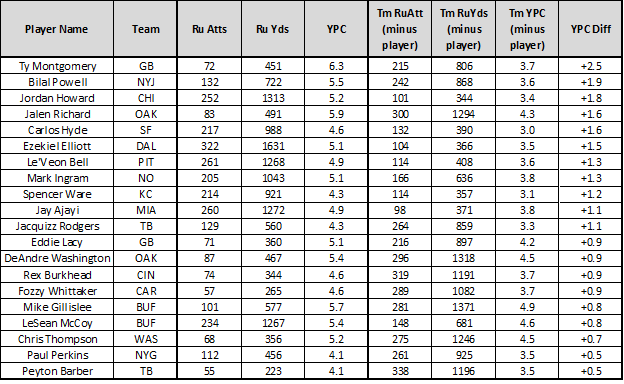
Again, this skews in favor of running backs whose teammates were clearly inferior talents. Sure, Ty Montgomery and Jordan Howard stand ahead of the pack, but maybe that’s not saying as much when their competition was James Starks and Jeremy Langford. This breakdown also bodes well for Jalen Richard and DeAndre Washington, who clearly outperformed their now former-teammate Latavius Murray. Bilal Powell stands out here as well, and I wrote about his prospects for the 2017 season here. There are also some positive signs for Carlos Hyde (who we will go more in-depth on below) and Spencer Ware.
This is also another positive sign for Ingram, whose recent usage is one of the most confounding for me. Over the last three seasons, Ingram (4.65) ranks behind only Le'Veon Bell (4.80) in yards per carry (min. 350 attempts). In 2016, among all 42 running backs with at least 100 carries, Ingram ranked third-best in missed tackles forced per attempt. Tim Hightower ranked third-worst. After getting benched in Week 8, Ingram posted 345 more rushing yards than Hightower, yet only out-carried him by 28. Prior usage seems to indicate this might be unlikely to happen, but all statistical data suggests Sean Payton might be better off using Ingram as his bell cow.
Adjusted YPC over expectation
Standard yards per carry also does a disservice to running backs who see a high percentage of their carries against tough run defenses. The next statistic we’ll look at builds out a yards-per-carry expectation by looking at each carry, which team that carry was against, and that team’s yards-per-carry average allowed during the 2016 season. Here were the running backs who ranked top-20 in yards per carry over their expectation (min. 100 rushing attempts).
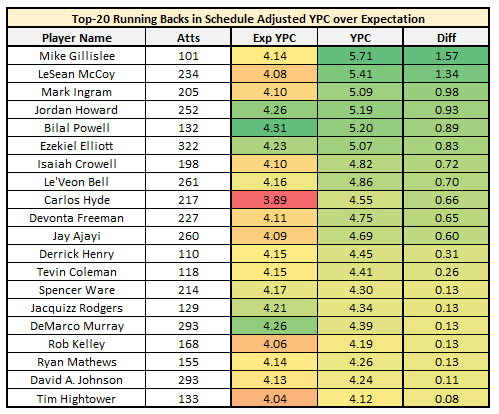
Hyde clearly stands out here, dealing with the toughest schedule of any running back with at least 100 carries. Playing in the NFC West put him at a significant disadvantage, considering Arizona ranked best in yards per carry allowed (3.30), Seattle ranked second-best (3.41), and the Los Angeles Rams ranked 12th (3.99). Games against these three teams accounted for 42.4 percent of his total carries. Hyde also stood out when we looked at his offensive line’s yards-before-contact-per-attempt average (seventh-worst) and how well he performed when compared to his peers (fourth-best). While I’m not very optimistic about San Francisco’s prospects as a whole, I do think the addition of Kyle Shanahan as head coach and offensive play-caller should account for an even greater boost in rushing production and efficiency for Hyde and the team as a whole.
Conversely, maybe I should be pumping the brakes a bit on Powell, who stands out as someone who benefited from a weaker schedule, posting the highest expected yards-per-carry average of any running back last season. Like with Powell, DeMarco Murray and Jordan Howard benefited here as well, ranking third and fourth respectively.
Defensive package-adjusted YPC over expectation
Finally, we’re looking at a statistic first developed by ESPN fantasy analyst, Mike Clay – defensive package-adjusted yards per carry. You can read the introduction here. As I mentioned earlier, running backs are at an advantage based on down and distance. A carry on 3rd-and-15 typically results in more positive yardage than a carry from on 4th-and-1. The biggest reason for this is because in the latter example, there are more defenders stacked in the box, making it harder for the running back to gain yardage. Looking at how many defenders are stacked in the box on any given run, we can see how well a running back performed over league average. Here were the 20 most-efficient running backs by this statistic (min. 100 rushing attempts).
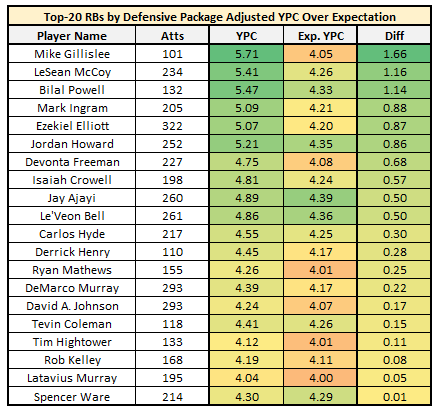
David Johnson's 4.24 yards-per-carry average looks much better when we factor in that defenses were consistently begging Carson Palmer to throw the ball. His expected yards-per-carry average was the 10th-lowest of any running back with at least 100 carries. Todd Gurley also stood out here, but for all of the wrong reasons. His expected yards per carry (based on defensive package) ranked a surprisingly high 13th-best, yet finished ahead of only Doug Martin in yards per carry over expectation.
Notes: Some rushing attempts were stripped out of my data set – most notably rushing attempts where the running back lined up as a quarterback or instances where a defense had too many or too few players on the field during the play.

