 Though we certainly miss football during the offseason, it’s always a good time to take a step back and analyze our plethora of data.
We’re often so busy grading and collecting data during the season that we’re unable to put a lot of the information to good use. With that said, we’ve decided to declare June as “QB Month” as we break down NFL quarterbacks every which way.
We’re going to examine quarterbacks from a number of situations before looking at each of them individually. The grades and numbers should reveal each quarterback’s strengths and weaknesses from the 2013 season.
As we go through this series, it’s important to understand the relationship between QB Rating (NFL’s version) and PFF Grade.
While QB Rating is obviously supposed to be a QB statistic, it’s actually a better gauge of what the entire offense did in a given situation. This is the type of information that is actually extremely valuable to our NFL team customers as their game planning efforts must go towards stopping an entire passing offense, not just the quarterback.
If the quarterback throws an easy dump off pass to the RB who then weaves through the defense for the touchdown, it’s certainly not a great indicator of quarterbacking skill as it is the running back and defense accounting for the majority of the work on the play. Of course the QB Rating will look quite shiny in that situation.
On the other hand, PFF Grade is a good indicator of how well the quarterback actually performed in a given situation. Whether they throw an accurate pass that was dropped, or perhaps an inaccurate one that should have been intercepted and the defense dropped, the PFF grade will account for those situations with a positive and a negative grade respectively while QB Rating will simply reflect the 0-for-1 passing.
It’s important to distinguish between QB Rating and PFF grade, though there’s a good chance they’ll match up in most situations.
After taking a look at the entire league in various situations, it’s time to break down each quarterback individually.
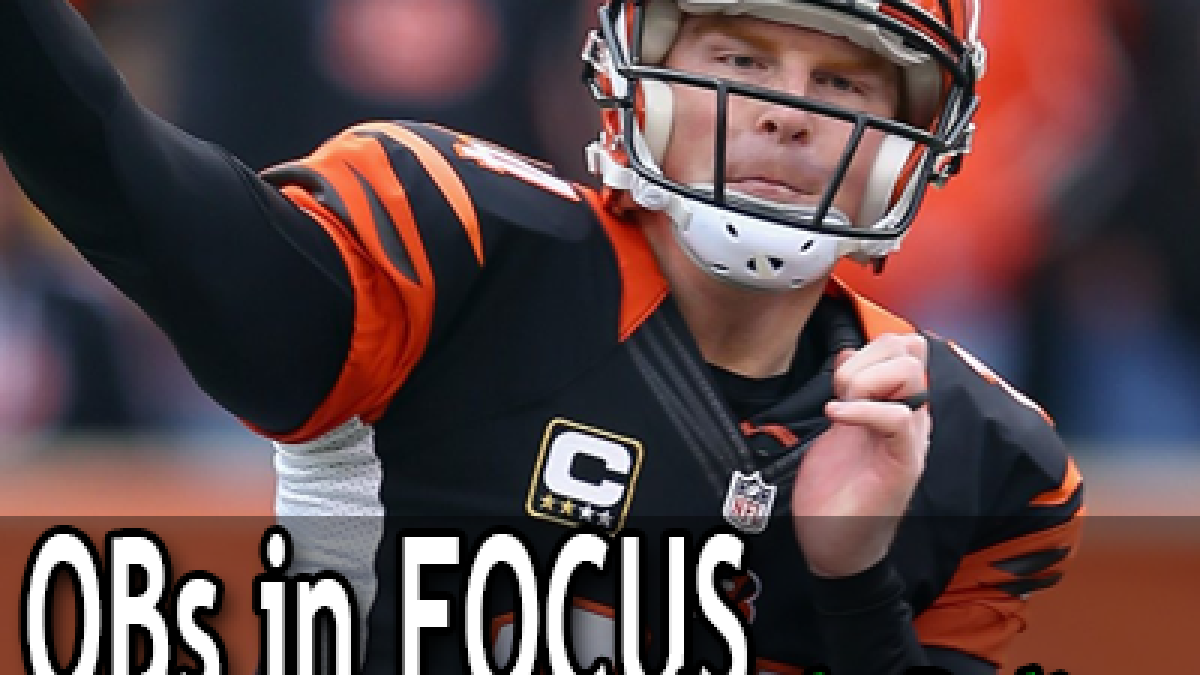
Andy Dalton
All categories with a * are normalized so that the league average is 0.0.
Positives
• Above average on passes in 11-to-20-yard range (+6.2) and passes in the 21-to-30-yard range (+3.1).
• Graded at +6.4 on passes thrown outside the numbers to the left and +3.9 on passes thrown in between the numbers.
• Graded at +11.7 in a clean pocket.
• Led the league with a +4.7 grade against pressure from a traditional rush.
• Graded at +5.4 on 7-to-8-yard drop-backs and +3.7 on drop-backs of 9 or more yards.
• Fourth-highest grade on drop-backs lasting 2.1 to 2.5 seconds (+11.1).
• Graded at +12.4 on passes to slot wide receivers.
• Tied for league-best +8.5 grade on corner routes. Showed well on posts (+4.3) and go routes (+5.5).
Negatives
• Graded at -3.1 on 3rd-and-long
• Third-worst grade on drop-backs that broke the pocket (-6.3).
• Graded at -5.6 on passes thrown in the 1-to-10-yard range and -9.8 on passes in the 5-to-10-yard range.
• Third-worst grade against blitz pressure (-9.5).
• Graded at -1.4 on 4-to-6-yard drop-backs.
• Struggled on drop-backs lasting two seconds or less (-6.6) and drop-backs lasting at least 3.6 seconds (-4.2).
• Graded at -1.8 on passes to tight ends, including -2.8 when lined up inline.
• Graded at -0.4 on slants and -1.8 on hitches.
Tendencies
• Threw 15.7% of passes at least 20 yards in the air; seventh-highest in the league.
• Threw 55.2% of passes outside the numbers; fourth-highest in the league.
• Faced pressure only 25.2% of the time; second-lowest in the league.
• 39.8% of drop-backs lasted two seconds or less; second-highest in the league.
• 30.5% of drop-backs were in 4-to-6-yard range; fourth-highest in the league.
• Only 13.0% of drop-backs went at least nine yards; seventh-lowest in the league.
• Only 15.0% of attempts went to running backs; seventh-lowest in the league.
• Threw screens on 12.4% of drop-backs (seventh-highest) including 9.3% to wide receivers (seventh-highest).
• Threw crossing routes 5.1% of the time (third-lowest) and in routes 2.7% of the time (second-lowest).
For the entire set of “Quarterbacks in Focus” posts, click here.
Follow Steve on Twitter.


 © 2024 PFF - all rights reserved.