 Yesterday, I released part one of my series on the tweaks I made to improve our opportunity-adjusted touchdown (OTD) statistic. I also recapped and discussed recent rushing OTD numbers.
In Part 2, I’m going to flip over to passing OTD. I covered receiving OTD throughout the 2013 season, but this is the debut for passing OTD.
If you’re new to the stat, be sure to check out my initial introduction. The OTD metric weighs every carry/pass/target and converts the data into one number that indicates a player’s scoring opportunity.
Click here for my piece on receiving OTD.
Note: Remember that passing OTD is based on the receiver’s distance from the end zone when he is targeted — not the line of scrimmage. This allows us to better weigh throws into the end zone.
Passing OTD
| Rk | Passer | Aimed | TD | OTD | Diff |
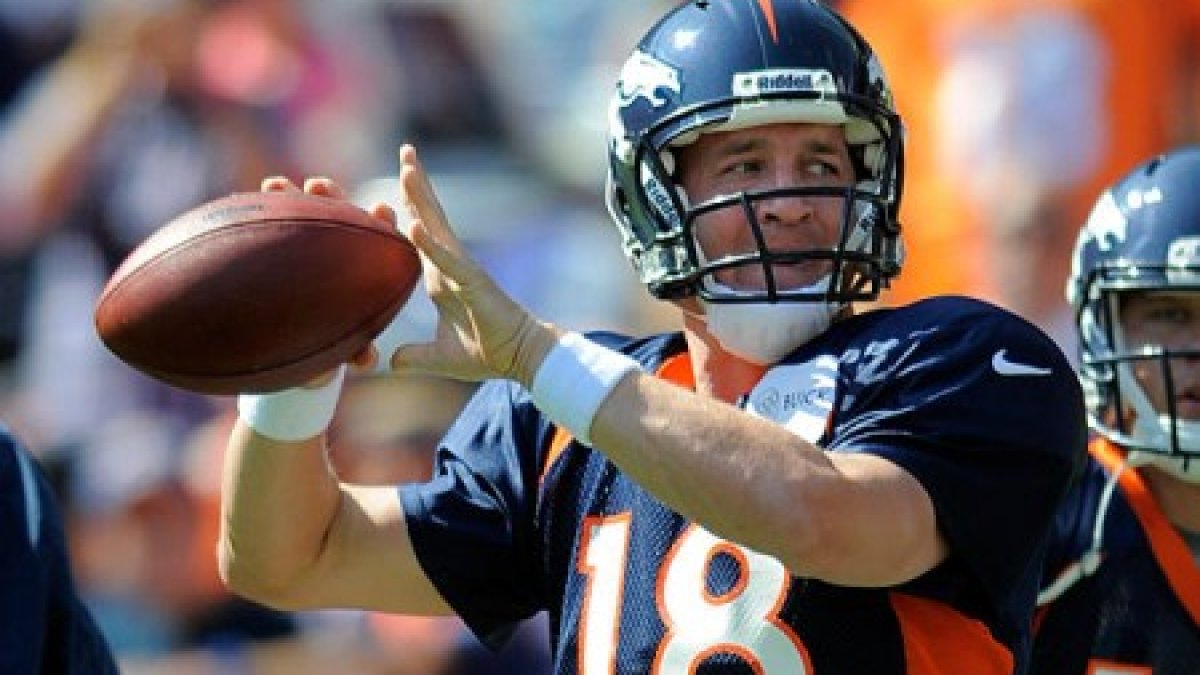
| 1 | Peyton Manning | 640 | 55 | 38.9 | 16.1 |
| 2 | Matthew Stafford | 595 | 29 | 30.5 | -1.5 |
| 3 | Tom Brady | 598 | 25 | 29.9 | -4.9 |
| 4 | Ben Roethlisberger | 550 | 28 | 29.5 | -1.5 |
| 5 | Drew Brees | 612 | 39 | 28.7 | 10.3 |
| 6 | Andy Dalton | 547 | 33 | 28.1 | 4.9 |
| 7 | Matt Ryan | 611 | 26 | 27.4 | -1.4 |
| 8 | Joe Flacco | 583 | 19 | 27.2 | -8.2 |
| 9 | Carson Palmer | 539 | 24 | 26.3 | -2.3 |
| 10 | Tony Romo | 512 | 31 | 25.7 | 5.3 |
| 11 | Philip Rivers | 510 | 32 | 25.2 | 6.8 |
| 12 | Andrew Luck | 534 | 23 | 24.6 | -1.6 |
| 13 | Jay Cutler | 331 | 19 | 22.3 | -3.3 |
| 14 | Eli Manning | 516 | 18 | 20.2 | -2.2 |
| 15 | Alex D. Smith | 473 | 23 | 20.1 | 2.9 |
Our first chart shows the Top 15 quarterbacks in terms of Passing OTD during the 2013 regular season.
In what should be a surprise to no man, Peyton Manning paces the league by a massive margin (8.4 to be exact). Manning tossed 50 passes into the confines of the end zone, which trailed only Matthew Stafford (51). Of course, Manning converted an NFL-best 26 of those throws, which was seven more than Stafford and one more than second-place Andy Dalton.
A glance at conversion rates on throws into the end zone is quite interesting. Among all quarterbacks with 20-plus tries in the category, Nick Foles had the most success with a rate of 64 percent (16-of-25). Colin Kaepernick (54 percent), Manning (52 percent), Mike Glennon (52 percent), and Dalton (50 percent) round out the Top 5.
On the other side of the coin we have the players who didn’t fare as well on end zone throws. Interestingly, Andrew Luck is dead last in the category. Luck completed only eight of his 34 tries (23.5 percent). Additional research will be required to determine if this is quarterback-, receiver-, or luck-dependent, but Luck did struggle in this area last year, as well. He was only slightly better at 28.2 percent (11-of-39). Rounding out the Bottom 5 are Matt McGloin (23.8 percent), Chad Henne (24.2 percent), Tom Brady (29.3 percent), and Geno Smith (30.4 percent).
One more random note here before I move on. Cam Newton somehow only completed five of 32 (15.6 percent) end-zone attempts in 2012. He improved by a massive margin to 15-of-31 (48.4 percent) in 2013.
| Rk | Passer | Aimed | TD | OTD | Diff |
| 1 | Peyton Manning | 640 | 55 | 38.9 | 16.1 |
| 2 | Nick Foles | 291 | 27 | 16.2 | 10.8 |
| 3 | Drew Brees | 612 | 39 | 28.7 | 10.3 |
| 4 | Philip Rivers | 510 | 32 | 25.2 | 6.8 |
| 5 | Russell Wilson | 377 | 26 | 19.3 | 6.7 |
| 6 | Ryan Tannehill | 548 | 24 | 18.6 | 5.4 |
| 7 | Tony Romo | 512 | 31 | 25.7 | 5.3 |
| 8 | Andy Dalton | 547 | 33 | 28.1 | 4.9 |
| 9 | Aaron Rodgers | 261 | 17 | 12.7 | 4.3 |
| 10 | Cam Newton | 435 | 24 | 19.9 | 4.1 |
Our next chart shows the quarterbacks who exceeded their expected touchdown total (aka their OTD) by the largest margins.
Considering the efficiency of both Manning and Drew Brees, it’s no surprise to see them near the top. Foles had a big sophomore season, but considering that he attempted fewer than half the passes Manning or Brees did, it’s quite interesting to see him second on this list. We mentioned his outstanding production on end zone throws earlier, which really pushes him over the top. In addition, Foles attempted four passes to a receiver standing at the 1-yard line. Three were converted into scores. Of course, it doesn’t hurt that the Philadelphia offense trailed only Denver in offensive touchdowns, providing Foles with plenty of scoring opportunities.
| Rk | Passer | Aimed | TD | OTD | Diff |
| 1 | Joe Flacco | 583 | 19 | 27.2 | -8.2 |
| 2 | Chad Henne | 461 | 13 | 19.7 | -6.7 |
| 3 | Tom Brady | 598 | 25 | 29.9 | -4.9 |
| 4 | Geno Smith | 405 | 12 | 16.3 | -4.3 |
| 5 | Matthew McGloin | 197 | 8 | 12.2 | -4.2 |
| 6 | Matt Schaub | 330 | 10 | 14.1 | -4.1 |
| 7 | Jay Cutler | 331 | 19 | 22.3 | -3.3 |
| 8 | Brandon Weeden | 242 | 9 | 11.7 | -2.7 |
| 9 | Robert Griffin III | 428 | 16 | 18.7 | -2.7 |
| 10 | Josh Freeman | 139 | 2 | 4.6 | -2.6 |
Finally, we have the quarterbacks with actual touchdown totals significantly below their expected marks.
Joe Flacco had a rough year and OTD shows some of why that is. The Ravens’ franchise player connected on only 14 of 38 (37 percent) end zone attempts. Even worse, he tossed 39 passes to receivers standing within 10 yards of the end zone. He completed only three (or 7.7 percent).
| Rk | Passer | Aimed | TD | OTD | Diff |
| 1 | Matthew Stafford | 1907 | 90 | 101.2 | -11.2 |
| 2 | Tom Brady | 1785 | 98 | 95.5 | 2.5 |
| 3 | Drew Brees | 1861 | 128 | 92.9 | 35.1 |
| 4 | Matt Ryan | 1733 | 87 | 84.3 | 2.7 |
| 5 | Andy Dalton | 1514 | 80 | 77.8 | 2.2 |
| 6 | Ben Roethlisberger | 1450 | 75 | 76.6 | -1.6 |
| 7 | Eli Manning | 1568 | 73 | 76.0 | -3.0 |
| 8 | Joe Flacco | 1591 | 61 | 75.9 | -14.9 |
| 9 | Tony Romo | 1633 | 90 | 73.3 | 16.7 |
| 10 | Philip Rivers | 1517 | 85 | 72.9 | 12.1 |
| 11 | Peyton Manning | 1200 | 92 | 69.7 | 22.3 |
| 12 | Aaron Rodgers | 1255 | 101 | 68.4 | 32.6 |
| 13 | Cam Newton | 1370 | 64 | 64.8 | -0.8 |
| 14 | Carson Palmer | 1386 | 59 | 60.5 | -1.5 |
| 15 | Ryan Fitzpatrick | 1356 | 62 | 60.3 | 1.7 |
Our final chart doesn’t require much analysis. It’s the same as our first chart except that it includes the last three years of data. What’s really interesting is how well the top of the “Diff” (or +/-) column passes the eye test. Brees (+35.1), Aaron Rodgers (+32.6), and Peyton Manning (+22.3) are clearly three of the best in the business.
Possibly even more interesting are the names toward the bottom of the list. We have seemingly overrated players in Flacco (-14.9) and Stafford (-11.2), poor players in Chad Henne (-11.3), Blaine Gabbert (-8.9), and Brady Quinn (-5.3); and inconsistent producers in Andrew Luck (-7.2) and Jay Cutler (-5.5).
Examining the relevance of +/- will be a project for another day, but, at first glance, the data is very interesting.
In Part Three of my series, I’ll take a look at the most interesting of the three OTD categories: receiving.
Follow Mike Clay on Twitter: @MikeClayNFL
