 If you are someone who tries to keep your eye off the ball during a play, something that can be fun to watch is who all is going after the quarterback. Some teams rarely bring something other than their typical four-man rush. Others seem to mix up who is going after the quarterback on every other pass play. Last year I examined how often teams blitzed and how successful they were in doing so. This year I’ll update the information for the 2014 as well as compare it to last year.
There are many ways to define a blitz, but here we’re defining it as someone pass rushing that the offense wouldn’t expect. For example, in a goal-line situation if there are six defensive linemen and they all rush the passer, that wouldn’t count as a blitz. However, in a base 3-4 defense if an ILB rushes instead of an OLB, it would count, even though it is still potentially just a four-man rush.
Blitz Percentage
The first part of the equation is how often teams blitz. The more a team blitzes, the more the offense needs to be ready for anything. The less they blitz, the more likely it can take the offense by surprise.
Like last year, we find the Arizona Cardinals near the top of the leaderboard. In their dime defense Deone Buchannon typically lines up near the line of scrimmage and rushed the passer 103 times — 34 more times than any other defensive back — and slot cornerback Jerraud Powers rushed the passer 54 times — 23 more times than any other corner. Most interesting at the top is the Rams who went from Tim Walton to Gregg Williams at defensive coordinator. Their personnel didn’t change too much from 2013 to 2014, but how often each linebacker and defensive back rushed the passer saw a significant increase.
Near the bottom of the list we find mostly 4-3 teams or teams with two good edge rushers. Most notable is the Bills who also saw a defensive coordinator change. Kiko Alonso rushed the passer 85 times in 2013, while no linebacker rushed more than 50 in 2014. The defensive backs also saw a decrease in pass rushes.
| Rank | 2013 Rank | Team | Blitzes | Dropbacks | Blitz % |
| 1 | 23 | SL | 274 | 602 | 45.5% |
| 2 | 1 | ARZ | 288 | 678 | 42.5% |
| 3 | 9 | IND | 302 | 730 | 41.4% |
| 4 | 10 | TEN | 244 | 604 | 40.4% |
| 5 | 15 | PIT | 238 | 631 | 37.7% |
| 6 | 3 | HST | 253 | 678 | 37.3% |
| 7 | 5 | GB | 259 | 696 | 37.2% |
| 8 | 11 | WAS | 195 | 585 | 33.3% |
| 9 | 18 | NYJ | 198 | 598 | 33.1% |
| 10 | 6 | MIA | 193 | 601 | 32.1% |
| 11 | 21 | NO | 194 | 605 | 32.1% |
| 12 | 12 | ATL | 196 | 613 | 32.0% |
| 13 | 17 | CHI | 194 | 607 | 32.0% |
| 14 | 7 | PHI | 211 | 668 | 31.6% |
| 15 | 14 | NYG | 176 | 593 | 29.7% |
| 16 | 8 | CLV | 190 | 645 | 29.5% |
| 17 | 13 | SD | 170 | 578 | 29.4% |
| 18 | 27 | MIN | 171 | 597 | 28.6% |
| 19 | 2 | OAK | 164 | 578 | 28.4% |
| 20 | 20 | KC | 171 | 616 | 27.8% |
| 21 | 16 | BLT | 213 | 771 | 27.6% |
| 22 | 31 | DET | 171 | 688 | 24.9% |
| 23 | 24 | CAR | 161 | 681 | 23.6% |
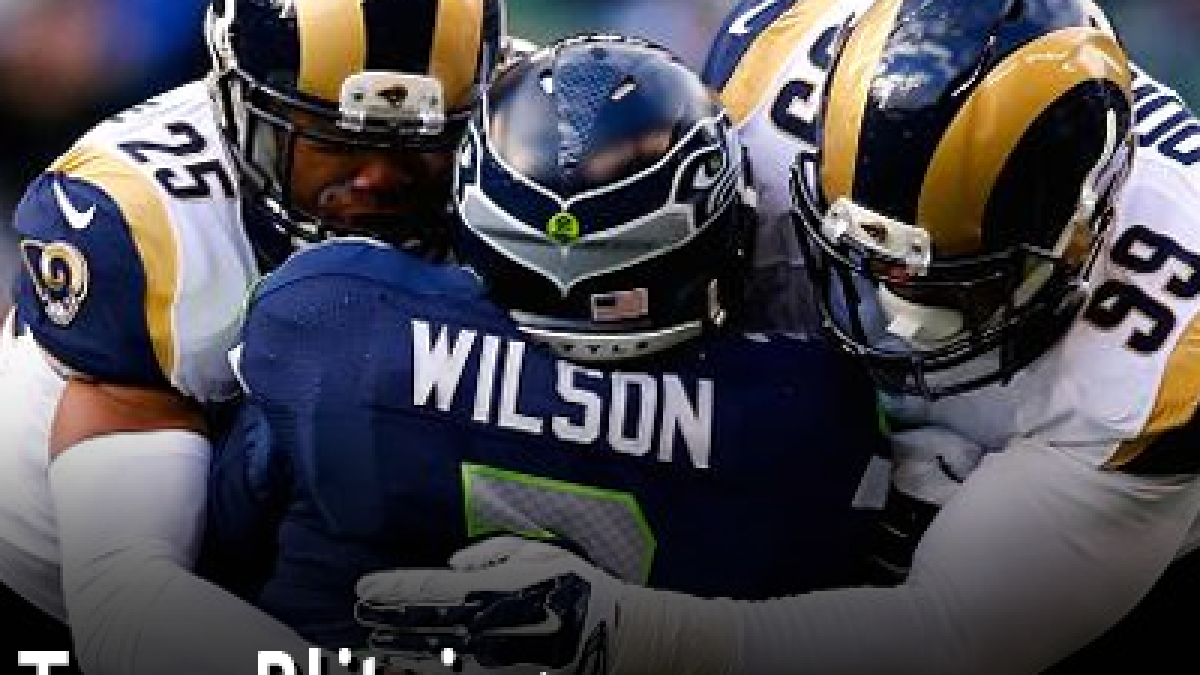
| 24 | 28 | SEA | 161 | 691 | 23.3% |
| 25 | 19 | DEN | 169 | 755 | 22.4% |
| 26 | 30 | SF | 133 | 605 | 22.0% |
| 27 | 26 | CIN | 146 | 695 | 21.0% |
| 28 | 4 | BUF | 134 | 640 | 20.9% |
| 29 | 25 | NE | 155 | 746 | 20.8% |
| 30 | 22 | TB | 124 | 613 | 20.2% |
| 31 | 29 | DAL | 129 | 684 | 18.9% |
| 32 | 32 | JAX | 90 | 602 | 15.0% |
Pass Rushing Productivity While Blitzing
Next are the teams that are best at blitzing as judged by our Pass Rushing Productivity Signature Stat. Like last year, we find a lot of the top teams are ones that don’t necessarily blitz often, but they just have a strong pass rush so occasionally adding another player only helps. A team like the Ravens move up to the Top 10 not so much because they have an inside linebacker or defensive back who is an impressive rusher, but more the front four they have are good, and adding a fifth helps.
A trio of teams who were in the Top 10 moved into the Bottom 10 in part due to decreased linebacker blitzing. For example, in 2013 the Buccaneers sent Lavonte David 105 times which led to eight sacks. In 2014 he only rushed the passer 56 times which led to one.
| Rank | 2013 Rank | Team | Dropbacks | Sacks | Hits | Hurries | PRP |
| 1 | 6 | MIA | 193 | 22 | 20 | 55 | 40.5 |
| 2 | 1 | SEA | 161 | 15 | 24 | 43 | 40.5 |
| 3 | 5 | SF | 133 | 7 | 12 | 50 | 40.2 |
| 4 | 9 | DEN | 169 | 15 | 27 | 41 | 39.1 |
| 5 | 2 | CAR | 161 | 14 | 18 | 47 | 39.0 |
| 6 | 22 | BLT | 213 | 19 | 45 | 39 | 38.5 |
| 7 | 12 | ARZ | 288 | 14 | 32 | 90 | 36.6 |
| 8 | 14 | BUF | 134 | 13 | 17 | 31 | 36.6 |
| 9 | 26 | NYG | 176 | 19 | 29 | 31 | 36.4 |
| 10 | 27 | PHI | 211 | 17 | 29 | 50 | 36.1 |
| 11 | 13 | NE | 155 | 14 | 19 | 37 | 36.1 |
| 12 | 21 | JAX | 90 | 9 | 12 | 18 | 35.0 |
| 13 | 10 | CIN | 146 | 6 | 20 | 40 | 34.9 |
| 14 | 17 | NO | 194 | 12 | 20 | 53 | 34.4 |
| 15 | 30 | PIT | 238 | 16 | 37 | 50 | 34.1 |
| 16 | 7 | DET | 171 | 14 | 20 | 39 | 34.1 |
| 17 | 19 | DAL | 129 | 9 | 15 | 31 | 33.7 |
| 18 | 32 | CLV | 190 | 13 | 16 | 52 | 33.7 |
| 19 | 25 | GB | 259 | 20 | 30 | 59 | 33.5 |
| 20 | 23 | SL | 274 | 27 | 27 | 59 | 33.4 |
| 21 | 16 | MIN | 171 | 12 | 22 | 38 | 33.3 |
| 22 | 24 | CHI | 194 | 14 | 25 | 41 | 32.7 |
| 23 | 29 | NYJ | 198 | 19 | 20 | 41 | 32.7 |
| 24 | 3 | WAS | 195 | 17 | 27 | 35 | 32.6 |
| 25 | 15 | IND | 302 | 25 | 38 | 57 | 31.9 |
| 26 | 18 | HST | 253 | 6 | 42 | 55 | 31.1 |
| 27 | 4 | TB | 124 | 10 | 10 | 27 | 30.4 |
| 28 | 31 | SD | 170 | 9 | 15 | 42 | 30.4 |
| 29 | 11 | TEN | 244 | 21 | 22 | 46 | 29.5 |
| 30 | 8 | KC | 171 | 12 | 19 | 29 | 28.1 |
| 31 | 20 | OAK | 164 | 9 | 17 | 29 | 26.5 |
| 32 | 28 | ATL | 196 | 9 | 22 | 34 | 26.0 |
Pass Rushing Productivity Without the Blitz
Finally, we look at how good teams are when they don’t blitz. In general, teams are a lot better at getting pressure when blitzing. However, if a quarterback can recognize the blitz and get a pass off, in general their numbers are better than when they aren’t blitzed. At the top of the list of a normal rush is the Houston Texans thanks to J.J. Watt. Next year if Jadeveon Clowney can live up anywhere close to the hype, they might produce an even bigger lead on the rest of the league.
The Packers and Giants were able to move up from the Bottom 10 to the Top 10 in part due to strong free agent additions of Julius Peppers and Robert Ayers. On the flip side, the Bills fell from first to 14th. All four of their starting pass rushers played well in 2014, but none of them played as well as they did in 2013. In St. Louis, Robert Quinn nearly single-handedly moved the team to the second spot, but his play came down to Earth in 2014 which brought the team’s performance down as well.
| Rank | 2013 Rank | Team | Dropbacks | Sacks | Hits | Hurries | PRP |
| 1 | 5 | HST | 425 | 31 | 48 | 79 | 29.7 |
| 2 | 7 | DET | 517 | 35 | 54 | 101 | 29.3 |
| 3 | 18 | PHI | 457 | 32 | 30 | 94 | 27.4 |
| 4 | 17 | NYJ | 400 | 24 | 35 | 76 | 26.8 |
| 5 | 25 | GB | 437 | 30 | 32 | 81 | 26.3 |
| 6 | 14 | MIN | 426 | 28 | 32 | 77 | 25.8 |
| 7 | 26 | NYG | 417 | 27 | 33 | 74 | 25.7 |
| 8 | 15 | BLT | 558 | 36 | 45 | 97 | 25.5 |
| 9 | 3 | SEA | 530 | 24 | 39 | 109 | 25.5 |
| 10 | 22 | WAS | 390 | 21 | 21 | 83 | 25.4 |
| 11 | 11 | KC | 445 | 34 | 18 | 87 | 25.3 |
| 12 | 23 | NE | 591 | 29 | 45 | 115 | 25.2 |
| 13 | 27 | PIT | 393 | 18 | 31 | 77 | 25.2 |
| 14 | 1 | BUF | 506 | 41 | 31 | 83 | 25.0 |
| 15 | 8 | NO | 411 | 22 | 20 | 86 | 24.7 |
| 16 | 6 | SF | 472 | 27 | 32 | 87 | 24.6 |
| 17 | 29 | OAK | 414 | 13 | 25 | 93 | 24.5 |
| 18 | 32 | ATL | 417 | 13 | 22 | 93 | 23.8 |
| 19 | 4 | CAR | 520 | 30 | 37 | 86 | 23.5 |
| 20 | 30 | CHI | 413 | 24 | 36 | 59 | 23.1 |
| 21 | 10 | MIA | 408 | 17 | 26 | 76 | 22.9 |
| 22 | 9 | DEN | 586 | 25 | 36 | 109 | 22.8 |
| 23 | 31 | SD | 408 | 17 | 27 | 74 | 22.7 |
| 24 | 28 | DAL | 555 | 22 | 42 | 96 | 22.6 |
| 25 | 13 | ARZ | 390 | 21 | 21 | 67 | 22.3 |
| 26 | 12 | TEN | 360 | 18 | 21 | 60 | 21.9 |
| 27 | 21 | TB | 489 | 25 | 37 | 72 | 21.8 |
| 28 | 2 | SL | 328 | 14 | 14 | 60 | 21.2 |
| 29 | 16 | CIN | 549 | 15 | 42 | 91 | 20.9 |
| 30 | 24 | JAX | 512 | 35 | 23 | 73 | 20.9 |
| 31 | 19 | IND | 428 | 20 | 22 | 59 | 18.9 |
| 32 | 20 | CLV | 455 | 18 | 19 | 70 | 18.6 |
* All data includes playoffs
* For Pass Rushing Productivity, if on a play one player had a pressure and another player had a sack, it was just treated as a sack. Therefore the data might not add up to what you see elsewhere on the site by individual totals. This was done so we could see — if you add up the sacks, hits and hurries — the number of plays on which a team created pressure.
Follow Nathan on Twitter: @PFF_NateJahnke
![]()

