[Editor's note: this story was originally published January 10, 2018 and has been re-surfaced to showcase how we grade quarterbacks during our 2018 Teaching Month.]
Quarterback is one position where there is an overabundance of statistics, not to mention wins and losses, to quantify how a passer is playing. But statistics are results-based numbers and often owe as much or more to players other than the quarterback. That influence from other players can warp or distort the perception of the quarterback’s play, effectively giving him credit or punishing him for things he had nothing to do with.
The basic tenet of PFF’s grading has always been to try and isolate the play of individuals from the rest of the team, giving you a true reflection of what they did, regardless of whether that was rewarded by teammates picking up the baton.
The easiest examples are obvious, like quarterbacks throwing bubble screens that go 80 yards for a touchdown based on the receiver breaking a couple of tackles and outrunning the defense. That hypothetical pass nets a quarterback a perfect passer rating of 158.3, but if the same pass is dropped by the receiver instead of taken the distance, that passer rating becomes 39.6, without changing anything the quarterback did on the play. It doesn’t take many of those in a season to completely twist a player’s numbers and drive an incorrect perception of how he played.
Passer rating in particular is a metric that describes overall passing production, and not simply quarterback play.
All other statistics have the same problem to some degree or other, which is why PFF’s grading can often lead to results that simply don’t mesh with the numbers everybody else is working from. While the initial reaction of many people to that is that there is something wrong with PFF’s system, the key to that difference is that PFF is measuring something that the rest of the data points aren’t – the performance of just the quarterback, as isolated from the impact of the supporting cast.
Just because a quarterback isn’t matching somebody else statistically or even in wins over a year doesn’t mean he hasn’t played as well, or even better.
Grading system
How does PFF actually grade quarterbacks? The basic grading system at PFF is a plus/minus scale, in which players are rewarded for positive plays above expectation and penalized for negative plays in increments of 0.5. Executing a simple screen pass will earn the quarterback a zero grade, as it is entirely expected.
Missing on the same screen will earn them a negative grade, because you expect an NFL quarterback to make that pass, but there is still room in the scale to punish them more severely if they miss in a way that puts the ball in danger of a turnover, or worse still if they manage to make such a mess of it that they pitch the ball straight to a defender for a pick-six with nothing to mitigate that negative grade.
These negative throws can be important because not all dangerous throws result in turnovers. In the 2017 NFL regular season, there were 288 dropped interceptions thrown by quarterbacks. Matthew Stafford alone had 15 of them, which goes a long way toward explaining why he ranked just 13th in PFF grades with a score of 83.3 despite ranking seventh in passer rating, fourth in touchdown passes and third in passing yards.
On the other side of the scale, there are plenty of positive throws that don’t get accounted for in the statistics because of some external factor, the most obvious of which being drops by receivers. In 2017, there were over a thousand completions (1,074) lost due to some form of receiver error, not even counting ones that could have been brought in had the receiver been stronger through contact with a defender. With almost 11,000 completions in the league total, removing receiver mistakes would push completions 9.0 percent higher.
Extra nuance
The black-and-white world of what should have been is only part of the divergence of the PFF grades from conventional statistics. Not all 20-yard completions are equal, even if the yardage gained is, and the resulting passer rating, etc. Quarterbacks can be heavily reliant on yards after the catch from their receivers to generate their production, and other players have to carry the passing offense far more by themselves.
The difference in how much of a quarterback’s passing yardage comes in the air can be huge. This season just 44.2 percent of Brett Hundley’s yardage came in the air, while the rest was the work of receivers after the catch. That was the lowest mark in the NFL. His average depth of target was 7.8 yards, despite taking 36 deep shots across 10 games of significant snaps.
At the other end of the scale, 65.1 percent of Jameis Winston’s yardage came with the ball in the air, 63.9 percent for Carson Wentz. Winston’s average depth of target was 11.1 yards, or 3.3 yards further down field than Hundley every time he attempted a pass on average. No matter how you quantify it, Winston was being asked to do significantly more with the football than Hundley.
Quarterbacks can of course influence yards after the catch, as impressive ball placement can allow receivers to catch passes without breaking stride, gaining additional yardage they wouldn’t have been able to, if they were forced to stop or adjust significantly to an errant pass. The grading accounts for these differences in accuracy, as what would ordinarily have been positively graded passes can lose some positive grade if the pass was inaccurate enough that it caused substantial yards to be left on the table because of the adjustment it forced.
Next comes the ball placement aspect — how much the same completion asks of the receiver versus being presented to him on a plate. Not all jump balls are alike, and some are really all about the adjustment from the receiver or the work he does to just take the ball away from a defender covering him. While a certain intangible credit can be given to quarterbacks for giving top receivers a chance to make a play, the play they actually make doesn’t make a poorly placed throw any better. (True jump balls are completed about 20 percent of the time.)
On the other hand, there are jump balls that don’t give a defensive back an opportunity to make a play, but require an impressive one from the receiver to reward the gamble. These nuances in ball placement and the reliance on receivers to complete their end of the play or defensive backs to fail to take advantage of their opportunities are another reason why statistics often just do not capture with accuracy what the quarterback did as opposed to what it resulted in.
Defining the PFF Grading System: Big-time throws and turnover-worthy throws
Now that we have a basic understanding of the PFF grading system, we can define the throw grades into different buckets. Each throw that is graded at the top end of the scale (+1.0s, +1.5s, and +2.0s) has been classified as a big-time throw. Conversely, the bottom end of the scale is reserved for turnover-worthy throws (-1.0s, -1.5s, and -2.0s). Here’s what they mean.
Big-time throws are valuable, turnover-worthy throws are bad.
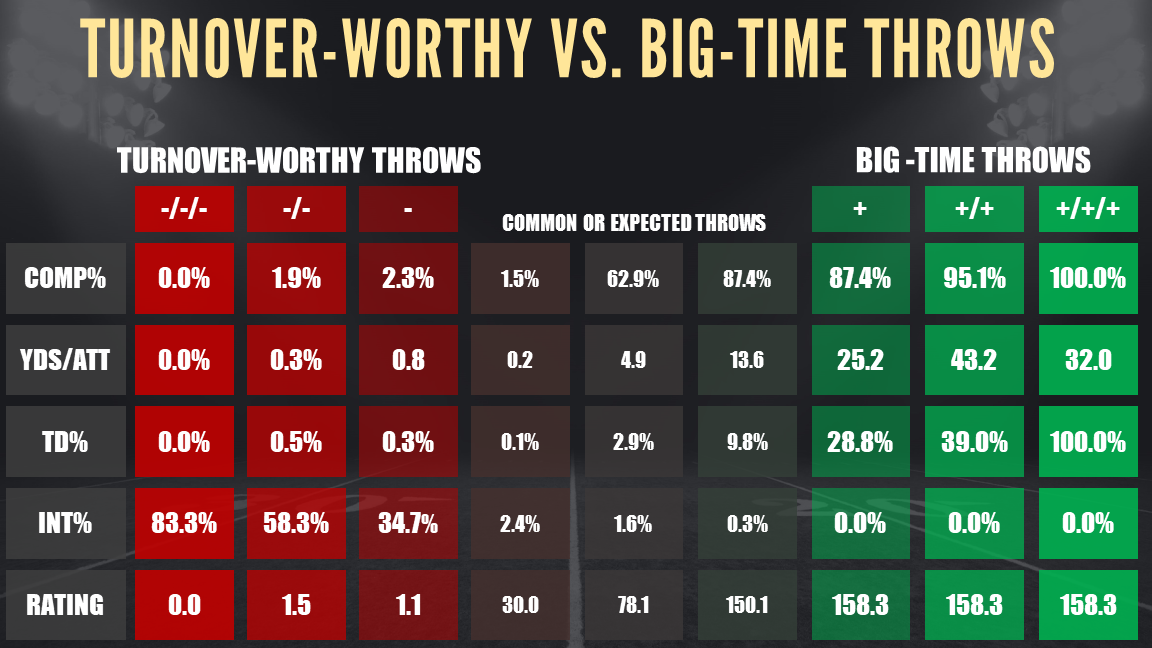
Well that seems obvious. Yes, but just how valuable is a big-time throw? Consider that all big-time throws resulted in a completion percentage of 87.6 percent, a touchdown percentage of 29.6 percent and a perfect passer rating of 158.3 in 2017. On the other hand, turnover-worthy throws resulted in a completion percentage of 1.9 percent, a passer rating of 1.2, and two lucky touchdowns. The polar-opposite results are expected given the definitions, but it’s an easy way to prove the value, or lack thereof, for each set of throws.
Looking even deeper, there are levels of good and bad within both categories. Here’s a statistical breakdown of big-time vs. turnover-worthy throws.
What is a big-time throw?
In its simplest terms, a big-time throw is on the highest end of both difficulty and value. While the value is easy to see statistically, the difficulty has more to do with passes that have a lower completion percentage the further the ball is thrown down the field. Therefore, the big-time throw is best described as a pass with excellent ball location and timing, generally thrown further down the field and/or into a tighter window.
The idea of the tight window can often bog people down as they ask, “Why do you want your quarterback to make riskier throws?” But it’s less about taking a risk and more about executing a pass that perhaps makes up for a deficiency on the offense. If a receiver can only create a tiny window of separation and the quarterback can put the ball in an optimum spot, he’s now created a big-play opportunity despite the receiver, not because of him. “Throwing receivers open” is a necessary skill at the NFL level, and big-time throws are just one way to capture it statistically. Sometimes difficult throws are necessary, because every offense will end up in unfavorable down-and-distance situations at times, and completing a regulation 3-yard out doesn’t help on 3rd-and-15.
Furthermore, we may see big-time throws under heavy pressure, turning a negative play into a positive, making a tight-window throw in the red zone where all passing windows are compressed, or perhaps throwing the beautiful 50-yard bomb down the field with good ball location. Hitting receivers #InStride is also important and more difficult to achieve the further the ball is thrown down the field. Well-thrown downfield passes that allow for further catch-and-run opportunities fall into the big-time throw category.
The levels of grading in the PFF system also allows for us to separate simple “catch opportunities” and “optimum throws.” Consider a 30-yard ‘go' route where the receiver has one step of separation. A quarterback can complete that pass with varying degrees of ball location, either hitting him perfectly in stride, hitting him on his frame for an easy catch, or underthrowing it just enough that the defender can get back in the play, but with the receiver still having the advantage. Allowing the receiver to catch and run is the important part of this scenario to achieve the big-time throw, while simply throwing a “catchable” pass may earn a positive, but it’s a step below optimum ball location.
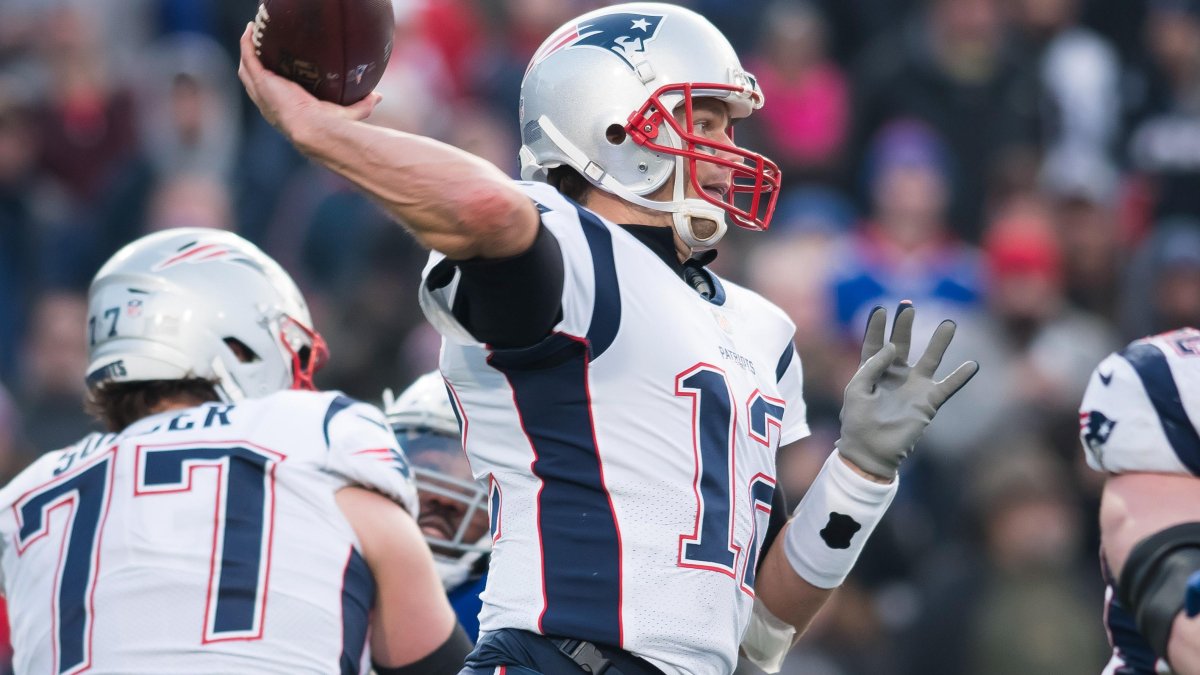
Tom Brady with #BigTimeThrows all over the place vs. the Steelers. Played better than the stat line showed pic.twitter.com/P00SW27PQQ
— Steve Palazzolo (@PFF_Steve) December 19, 2017
What is a turnover-worthy play?
For quarterbacks, there are two ways to achieve a turnover-worthy play: throw a pass that has a high percentage chance to be intercepted or do a poor job of taking care of the ball and fumbling.
Let’s start with the coulda/woulda/shoulda interceptions. Remember, we’re isolating the quarterback’s play in the PFF system and his grade on a given play will encapsulate his decision, timing and accuracy for the throw. With that in mind, there will be many times in which a similar throw will net a different result. Misreading coverage and firing a pass to a linebacker will result in the same grade whether he catches it for an interception or not.
There are a couple more key points to remember with turnover-worthy plays:
- There are different levels of turnover-worthy plays
Not all turnover-worthy plays are created equally, and much like with big-time throws, the PFF system is able to capture the various levels of these poor throws. There’s a difference between a pass that is late and allows a defender a clean break on the ball versus the clear misread that is thrown right to a defender to the even more egregious pass right to a defender that is the easiest of catchable interceptions. All of those examples are “turnover-worthy” but not only are they at different levels when evaluating the quarterback’s play, but they also vary in how often they occur.
- Not all INT-opportunities or fumbles are turnover-worthy
We all know that not every interception is the quarterback’s fault, but even in the case of turnover-worthy plays, there may be interceptions that are considered downgrades for the quarterback, yet not turnover-worthy. Examples of plays in which the quarterback assumes some fault, yet they are still considered “unlucky” to have been intercepted, include passes with poor ball location that get deflected up in the air or overthrows that end up as interceptions on plays where they’d normally fall incomplete. We can rely on our 2017 quarterback data to know that downgradable throws from the quarterback that are not considered turnover-worthy were intercepted 2.4 percent of the time, so while the quarterback gets his proper deduction, it’s not in that turnover-worthy category if it happens to be picked. Of course, there are even clearer pictures that can be painted, whether it’s a dropped pass or even a positively graded throw that is tipped up and intercepted, the quarterback will receive proper credit for his part in the play.
As for fumbles, there are many degrees of blame when it comes to the quarterback. The first thing to note is the quirkiness of NFL rules where quarterbacks will receive the “fumble” stat on poor snaps by the center, missed handoffs, dropped pitch plays and other situations where there’s simply no clear-cut evidence that they are to blame for the play. All of those situations are graded properly for context in the PFF system, despite the fumble stat.
There are also strip-sacks that are unavoidable and mostly due to something in the pass protection and those are plays where the quarterback may be absolved of the turnover-worthy label. However, fumbles in which the quarterback has a clear chance to avoid the ball coming free will result in a heavy downgrade and it will go into the turnover-worthy play category, even if the ball is recovered by the offense. Recovering fumbles is more luck than skill, and the quarterback will receive the turnover-worthy downgrade for putting the ball in harm’s way.
- Not all turnover-worthy plays become turnovers
As the previous chart shows us, not all turnover-worthy plays will become turnovers. Using 2017 data, throws graded -1.0 were intercepted 34.7 percent of time, throws graded -1.5 were intercepted 58.3 percent of the time, and throws graded -2.0 were intercepted 83.3 percent of the time. They all fit into the turnover-worthy category despite different levels of interception probability, but there is a clear difference between the turnover-worthy throws and the throws graded -0.5 that result in an interception only 2.4 percent of the time. Therefore, it’s fair to put turnover-worthy throws in their own category, despite 48.2 percent of all turnover-worthy throws resulting in interceptions.
- But you’re grading “what-ifs”
No, we’re grading what happened, not what that resulted in. There’s no “what if” when a quarterback makes a clear misread, there’s simply a varied result on the other side of the play: interception or no interception. Staying consistent with the grading regardless of the result is the most important thing when isolating players for evaluation, and that will always be our goal at PFF.
Using the PFF system and getting the most out of the QB Annual
While each quarterback will be given one overall grade, it’s the nuance that builds the grade that is most important. Did a quarterback have a high percentage of positive grades and a high percentage of negative grades, leading to an 80.0 overall grade? Did a similarly graded 80.0 overall quarterback achieve that mark through a safer approach of low positives and low negatives?
The construction of the grade is as important as the grade itself, and the QB Annual has a number of tools to help unlock the context to each overall number, further explaining why the grades might show different results to conventional statistics.
Signature stats
Always a staple at PFF, signature stats allow for a statistical look to back up each quarterback’s grade, breaking down his strengths, weaknesses, and style using in-depth statistics.
Grading profile
Comparing a quarterback’s big-time throws, turnover-worthy throws, overall positives, and overall negatives gives a big piece of the story as to how a quarterback achieved his given grade.
Situational analysis
Defining when and where a quarterback achieved his stats and grades adds the next layer of context. Did he dominate on third downs? In the red zone? Against the blitz? Situational analysis further paints the picture as to where a quarterback failed or succeeded.
The PFF Edge subscription grants you access to the very first PFF QB Annual, dissecting how every quarterback played under every imaginable scenario.
Here's how the NFL stacked up in big-time throws and turnover-worthy throws in 2017:
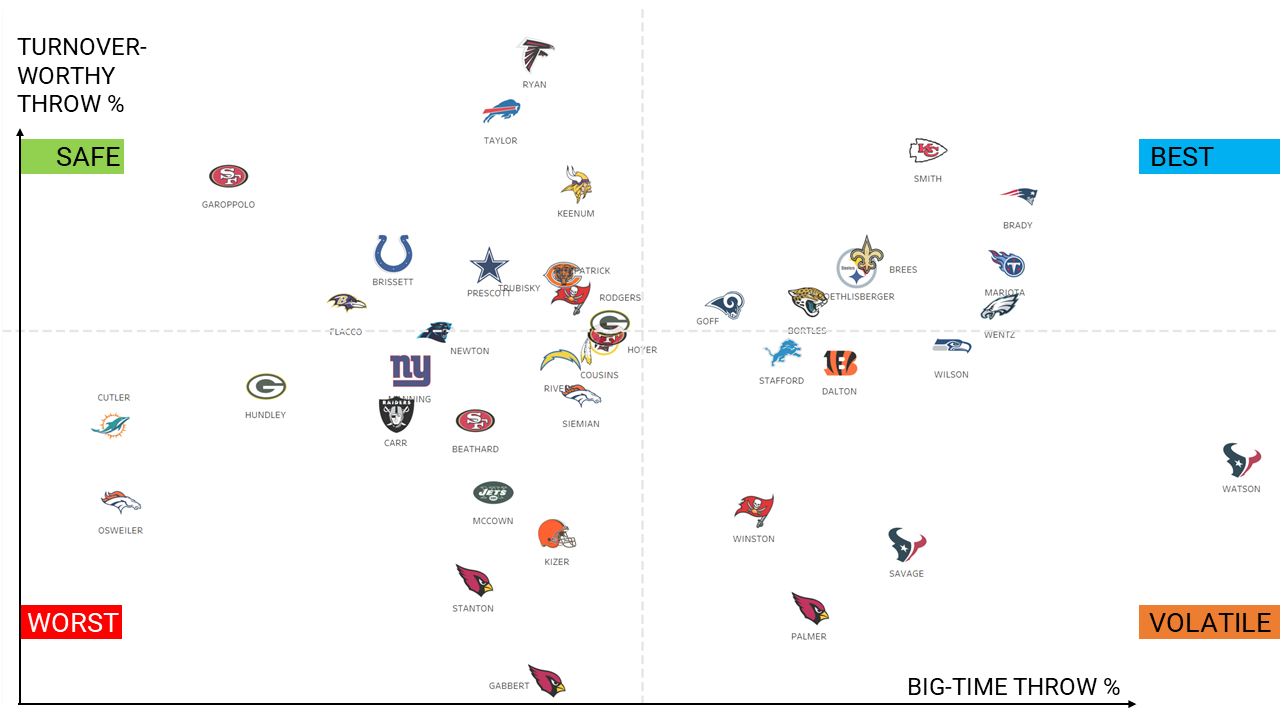
Big-time throws create big plays while turnover-worthy plays result in turnovers about half the time. The top right is the best place to be where BTTs are high and TWPs are limited. The more volatile players reside in the bottom right as players with high numbers of BTTs and high TWPs, while the top left is the more conservative quadrant of low BTTs and low TWPs.
*This chart includes plays nullified by penalties as we do assign proper credit/blame to quarterbacks when applicable.
- Patriots QB Tom Brady and Chiefs QB Alex Smith had the best BTT/TWP ratios this season as they were the only two quarterbacks to rank in the top five in both categories.
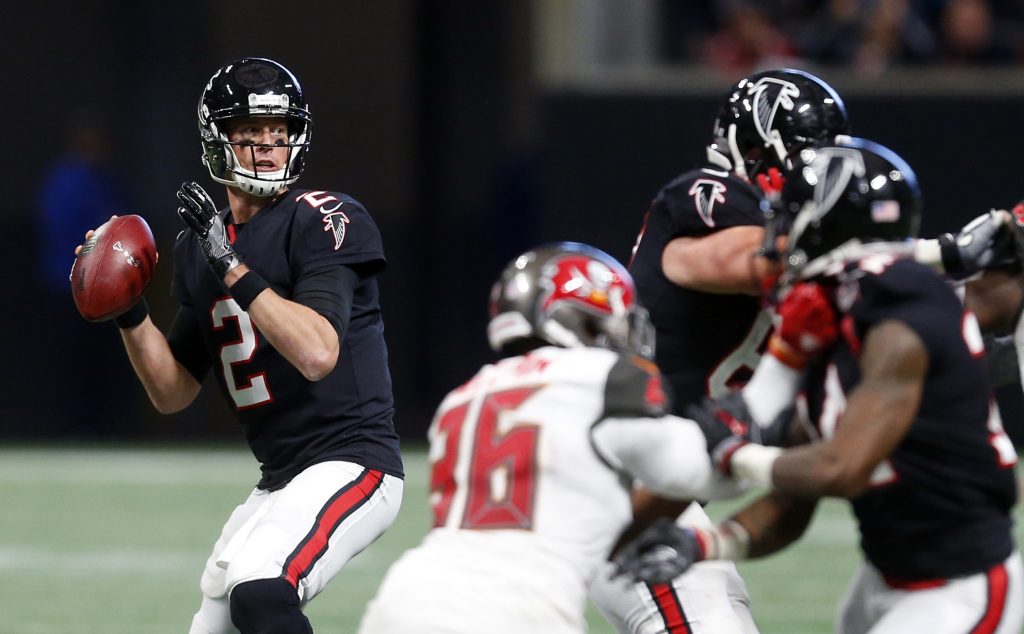
- Falcons QB Matt Ryan fell into the safe category with the lowest percentage of turnover-worthy throws but he ranked only 25th in big-time throw percentage.
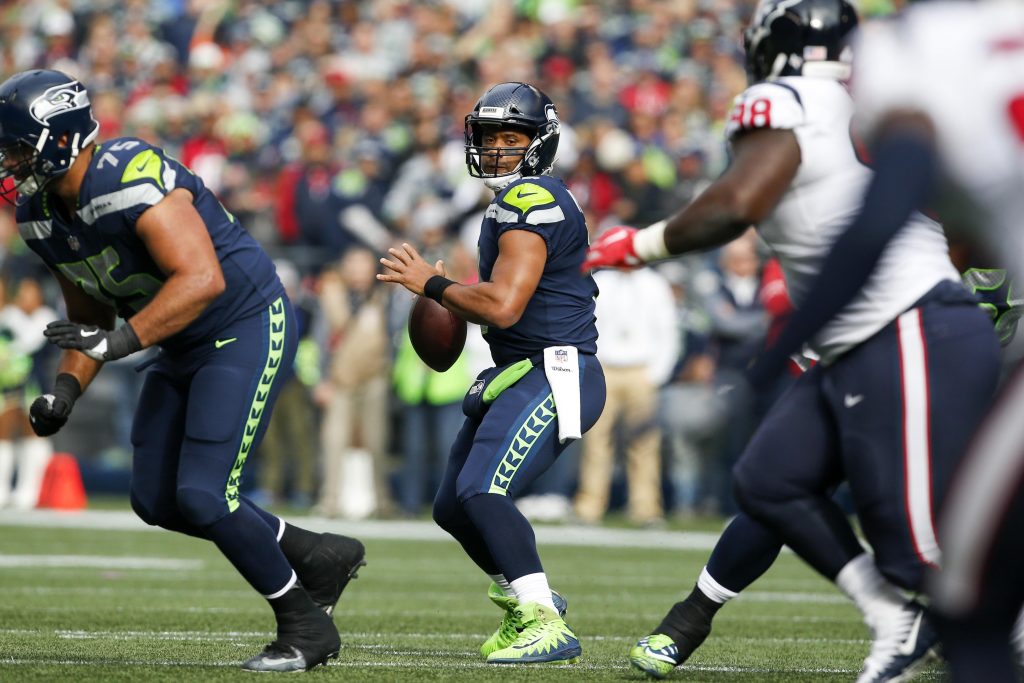
- Texans rookie QB Deshaun Watson was on the extreme end of volatility, ranking first in big-time throw percentage and 32nd in avoiding turnover-worthy plays.

