
Much of the hype, money and glory in the pass-catching/pass-defending realm of the NFL is heaped on the outside wide receiver and the “shutdown” outside corner. Chris Harris Jr. is the highest-paid corner who doesn’t play the majority of his snaps outside, yet he has just the 21st-most lucrative contract on a per year basis (via overthecap.com). Similarly, only two of the 15 highest-paid receivers played a majority of their snaps in the slot (Jarvis Landry – fifth, and Doug Baldwin – 13th). The best tight end in the game, Rob Gronkowski (93.3 PFF grade – first) has an annual salary that would rank 21st among all wide receivers.
Is there an inefficiency here? Or does the outside target really carry the most weight in the NFL game? If there is an inefficiency, which players and coaches are taking advantage of it the most?
To begin this discussion, we will use PFF player participation data to isolate the target position (where the targeted player lines up) and the position of primary coverage (again where that player lined up) and look at the relative values associated with earning various levels of PFF grade at those positions. Being valuable is one thing, but stability is also part of the equation – we will take a look at which receiving and which coverage positions are the most consistent in terms of performance (PFF grade) and value (expected points added per play). We are also compelled by our belief system to discuss the quarterback, so we will also take a look at the stability of targeting certain positions from the team and individual quarterback’s perspective.
The Metrics and Why We Use Them
Since it is Teaching Month here at PFF, it makes sense to spend a little time discussing the metrics that we’ll be using.
PFF play-by-play grades have the goal of measuring performance regardless of the play outcome. For facets such as receiving and coverage where there is a lot of randomness involved in the play, we like to use a number that has a goal of eliminating as much of that noise as possible. For a more detailed look at the grading process, check out Senior Analyst Steve Palazzolo’s tutorial on YouTube.
Expected Points Added (or EPA) sounds a little wonky but it is really a quite simple concept which provides an excellent framework for measuring the value of a play. Before we understand what it means to add expected points (first introduced in the book “The Hidden Game of Football” that was published in 1988 and written by Bob Carroll, John Thorn and Pete Palmer), it would make some sense to get a handle of what expected points are to begin with. Just consider any point in a NFL game, perhaps the offense is on the 50-yard-line, it's third down and they need five yards to gain for a first down. From this position what do you expect to happen? Do you expect the offensive team to go on and score a touchdown or a field goal? Or do you expect the defense to get a stop and for the opposing offense to score next?
There are many instances of each occurrence over the course of time and we use some fairly basic mathematical-learning techniques to put a numerical value on what we expect to happen on the next scoring play (we use a similar method to the one used by Ron Yurko who has done excellent open source work here. For any position on the field, there are different probabilities associated with each potential outcome of the next scoring play – sometimes there is a high probability the offense will score a touchdown, but in other situations the probability might be more heavily distributed to scores by the current defensive team happening first (when an offense is backed up deep in its own territory). Taking these probabilities into account we get a number which represents the expected points for any team at a given field position, down and distance.
![]()
Concretely, let’s say that the expected points the offense in the above situation is 2.1, this number is a combination of all the various probabilities we associated with the different possibilities for the next score. Since the number is positive we expect the current offense to score next (though it might not be on this particular drive). Had the offense been at their own 5-yard-line, we might have seen a -2.1 expected points, which would mean we expect the other offense to score next. One of the benefits of expected points is that we can compare the values before and after a play to see if the result of the play increased or decreased the offense's expected points. If the expected points increased as the result of the play, then that play added to the expected number of points the offense will score on the next scoring play (this is a good thing).
EPA is simply the expected points added by a given play, which is either positive or negative, and is determined by comparing the expected points for the offense before and after a play. This helps to contextualize yardage, a five-yard completion on 3rd & 5 from the offense’s 35-yardline picks up a first down, and subsequently increases the its chances of scoring on that drive and hence increases their expected points (so it will have a positive EPA). A five-yard completion on 3rd & 10 from the 35 results in a 4th & 5 at the 40-yardline, which lowers the offense’s chance of scoring, and hence the EPA for that play is a negative number.
Every time a quarterback throws a pass, whether it be to a player lined up in the slot, out wide, as an inline tight end or in the backfield, there is an EPA. Sometimes the EPA is large (perhaps even close to seven), sometimes small (you pick up five yards on 1st & 10) and sometimes negative (incompletion, sack or interception). We’ll use EPA on a per-play basis to measure the value of targeting certain offensive and defensive positions.
Value of Targeting Different Positions
As we’ve written about previously, the differences between passing-game outcomes when the targeted player is the slot versus out wide or in the backfield are not trivial. Throwing to a player lined up in the slot or at tight end is worth more expected points on average than throwing to players on the outside (or from the backfield). Our new quarterback charting data helps to contextualize why this might be the case – over the last two seasons, passes to slot targets had a step or more of separation nine percent more often than passes to targets who lined up out wide. Offenses have taken advantage of this difference as Baldwin, Golden Tate, Larry Fitzgerald and Adam Thielen were all top 10 graded wide receivers in our system and tight ends Gronkowski and Travis Kelce have been the most-valuable players in their team’s passing game for years now. Quarterbacks that finished in the top five a season ago when throwing to the slot (in terms of expected points added), Jimmy Garoppolo, Carson Wentz, Alex Smith, Tom Brady and Russell Wilson, were among the league’s best overall at their position a season ago as well.
While slot cornerbacks are still pretty undervalued dollar-wise, there have been a few moves in the right direction both in free agency and the draft, as teams have learned that stopping passes in the middle of the field is important.
This past season, we have some excellent examples of players and coaches who utilized the slot position well.
The New Orleans Saints have a bevy of talented offensive players, starting with one of the best quarterbacks we’ve seen in Drew Brees (88.6 PFF grade – tied for second) and an offensive wizard for a coach in Sean Payton. One of their most potent weapons is wide receiver Michael Thomas (91.8 PFF grade – second) –what’s interesting is the way that Payton utilized Thomas on the most important plays. On third and fourth downs, Thomas lined up in the slot on 32.9 percent of snaps compared to 17.1 percent on first and second downs. On third and fourth downs with Thomas in the slot, the Saints more than quintupled their EPA per play over what they averaged with Thomas lined up wide.
The Super Bowl Champion Philadelphia Eagles make this list two-fold. In 2016, Carson Wentz ranked 21st in EPA per slot target and had a slot passer rating of 93.6 (22nd). 2017 was a totally different story for Wentz, Doug Pederson and the Eagles, Wentz ranked second in EPA per slot target and his passer rating of 132.1 when targeting the slot was second to none. We would be remiss if we did not mention that Garoppolo ranked first in EPA per slot target and grade per slot target (albeit with about one-third as many attempts), showing again, as he once did with a few loaves and a couple fish, that you have to take advantage of what you have or no one will get to eat.
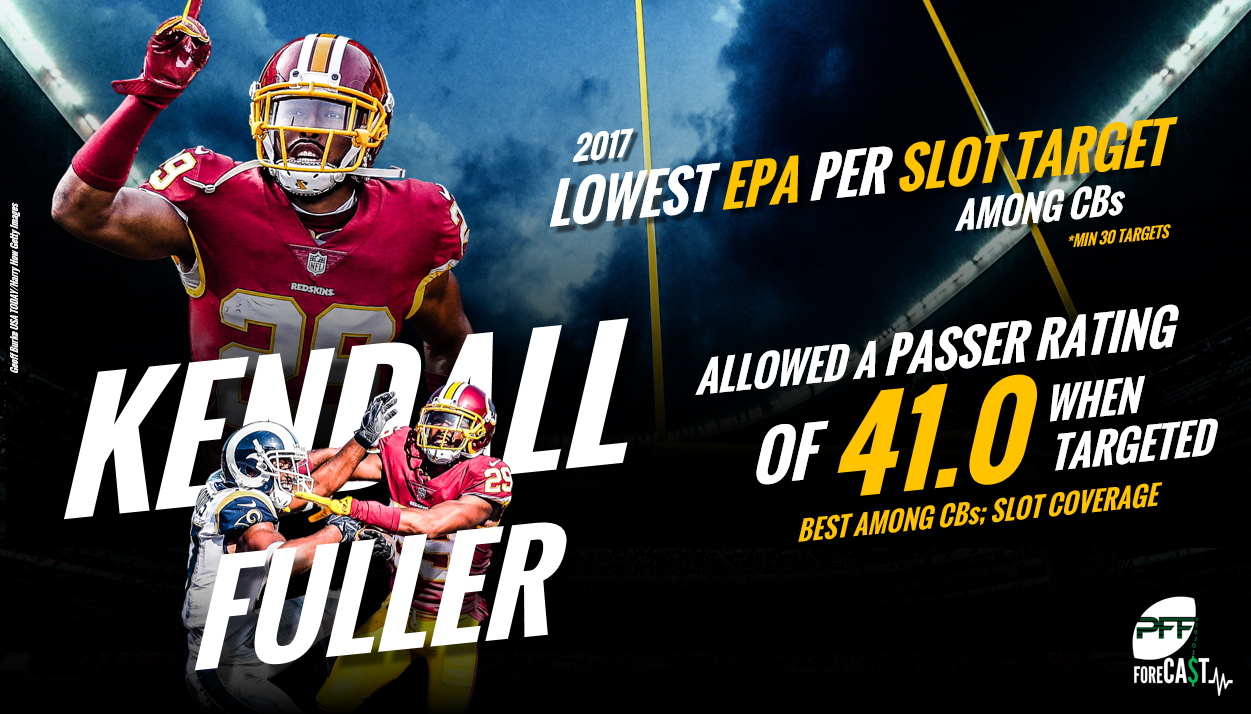
On the defensive side of the ball, the Eagles had one of the best slot corners in the league last year. Patrick Robinson earned an 89.8 PFF grade, edged out by former Redskins CB Kendall Fuller (90.0) for the best grade among slot corners. With Robinson's addition and perhaps a little bit of destiny, the Eagles faced the fewest slot targets of any team and ranked third in EPA per play allowed on slot targets (behind Minnesota and Jacksonville). Not to be outdone, Fuller was a black hole for opposing slot receivers, allowing the lowest EPA per slot target of any corner with at least 30 targets. Opposing quarterbacks had a passer rating of just 41.0 when targeting a slot receiver in Fuller’s primary coverage (first) and Washington went from ranking 31st in EPA per slot target in 2016 (Fuller had a 45.5 grade) to 10th in 2017.
Stability When Targeting Different Positions
While what happens from the slot is valuable, as often happens, things that are valuable in football aren’t necessarily the things that are the most stable. Thus, we looked at how stable PFF grades and Expected Points Added generated (or allowed) per target were for both teams as a whole, as well as passers, receivers and coverage defenders.
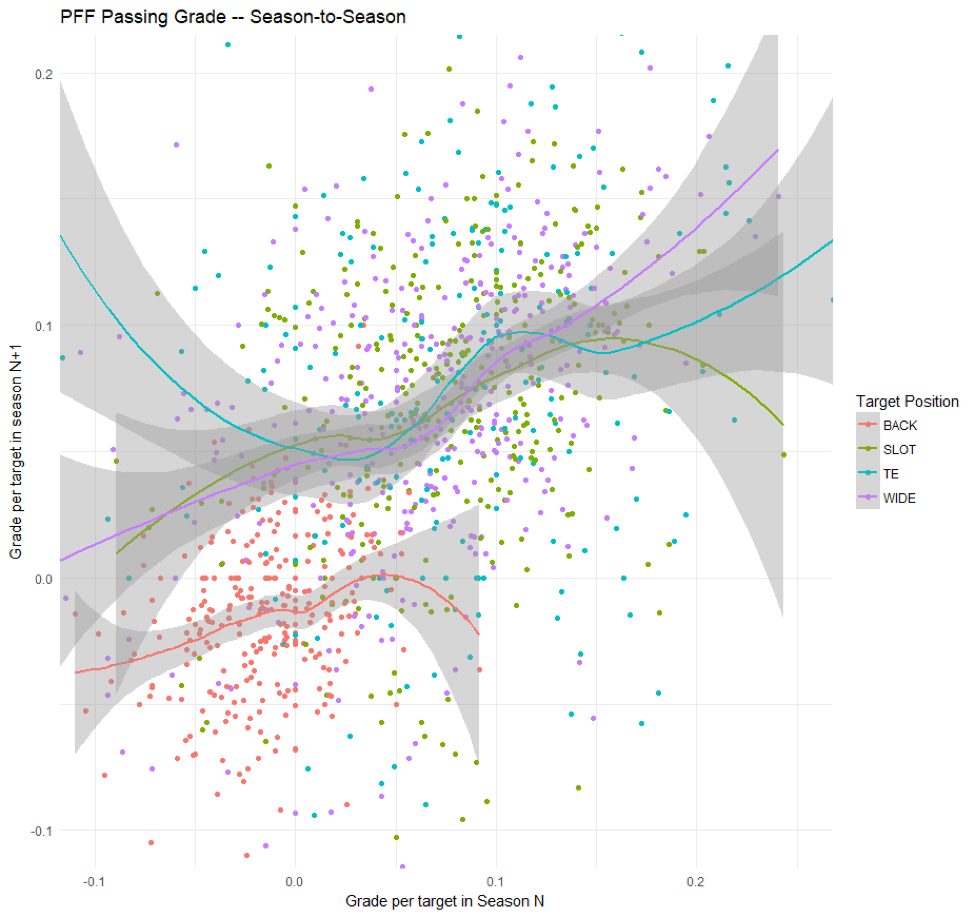
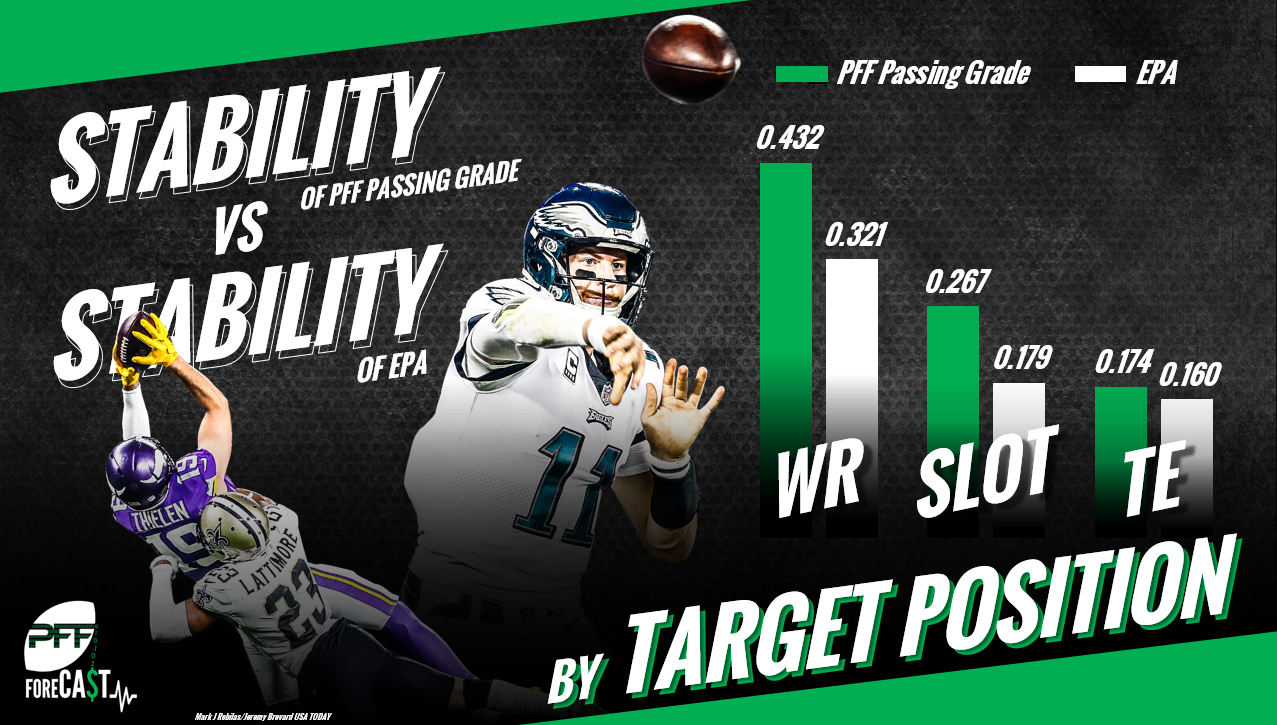
We took all quarterbacks seasons since 2006 and split their aimed throws by target position (minimum 30 targets). Season-to-season we found that PFF passing grade when targeting players lined up at wide receiver was significantly more stable (correlation coefficient of 0.432) than grade per slot target (0.267), grade per tight end target (0.174).
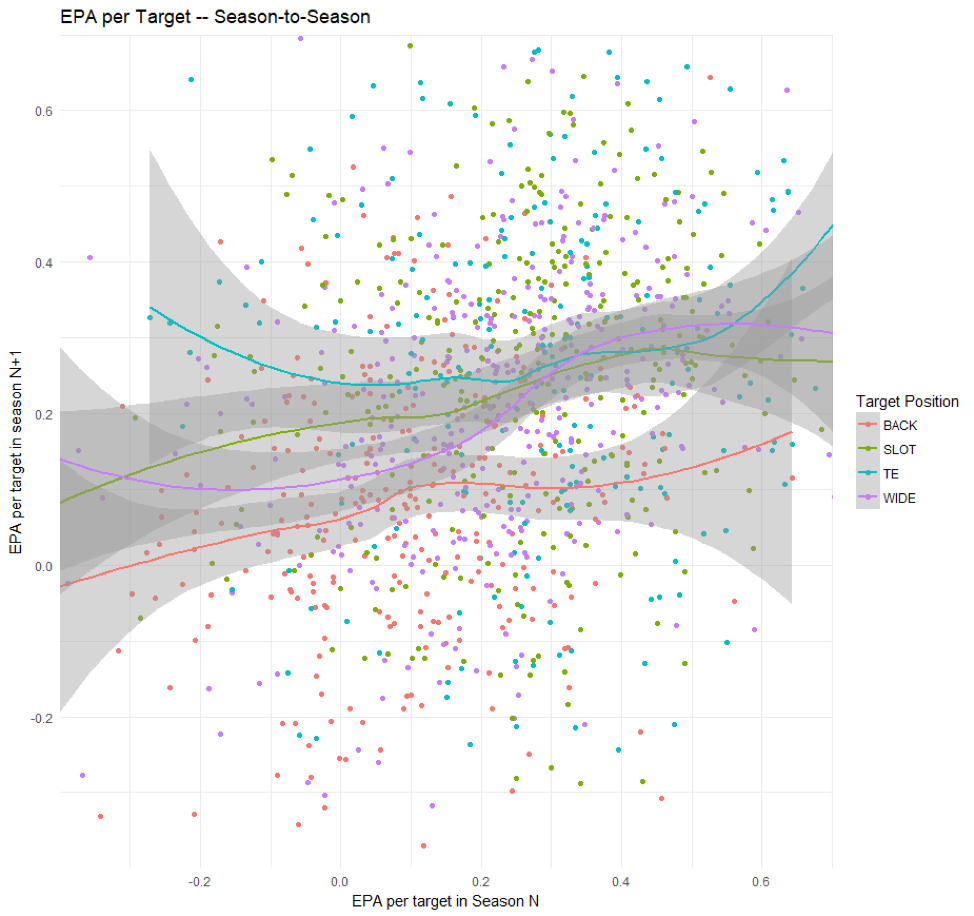
Season-to-season EPA per target stability is slightly lower than PFF grade, which makes sense considering that player performance would be more robust to changes around them while value from a given play requires a few more moving pieces. The season-to-season correlations for EPA per wide target still reign supreme (0.321), EPA per slot target is a distant second at 0.179 and EPA per tight end target (0.160) and EPA per backfield target (0.153) are not far behind.
In general, we see that both performance and value generated per throw are more stable to targets lined-up on the outside than any other position and that performance using PFF grades is more stable than EPA per target across all positions.
We found that – at the team level – PFF receiving grade per snap is roughly equally-correlated season-to-season from the outside (correlation coefficient 0.262), the slot (0.247), from the tight end spot (0.247) and the backfield (0.263). EPA generated per play, however, is a bit different, as per-play value on targets to outside receivers correlates at a higher rate (0.330) than per-play value on passes to the slot (0.252). Per-play success running routes from out wide or the slot is considerably-more stable than from the tight end spot or the backfield. In terms of football, these metrics are not nearly as stable as others (e.g. pass-rushing), but the fact that receiving grades from all four broad position groups are mostly equally stable is encouraging.
In terms of EPA, it’s interesting to note that, as we hypothesized, passes to the slot are less stable in terms of value than passes to the outside, even though passes to the slot carry more value on a throw-for-throw basis and the rate at which slot players are targeted is more stable than that from the outside (0.641 versus 0.544) at the team level. The drop in stability in EPA for tight ends is likely due to variability in touchdown rates, while throws to running backs have not been terribly valuable to begin with, and thus their instability is not heartbreaking nor surprising.
At the individual player level, we see similar results, with only tight end’s PFF grade per target dipping below the other three positions in terms of stability (we only took players with 30 or more targets at a given position in both seasons in our player-level analysis). PFF receiving grade earned per slot target was slightly more stable (0.232) at the player level than that from the outside (0.202), but the stability in EPA generated per target on both were basically the same (0.175 versus 0.184, respectively). Thus, in terms of individual receivers, it appears the slot still offers an advantage that isn’t overcome by lack of stability on a year-to-year basis for individual players.

In terms of coverage, results (from the perspective of EPA per target in primary coverage) were not remarkably stable season-to-season at either the player or team level. For deep safeties and box safeties/linebackers, EPA allowed at the team level was correlated at a rate roughly 0.13, while at the player level there was no correlation (-0.015 and 0.03, respectively). PFF coverage grades for box safeties and linebackers were slightly more stable (0.159 team level, 0.208 player level), but the same wasn’t true for safeties (0.077, 0.056).
For cornerbacks, the value allowed (in terms of EPA) from the slot was more stable (0.123) at the team level than from the outside (0.075), but correlation coefficients were pretty small at the player level for both. PFF grades for outside cornerbacks were more stable than for slot players both at the team level and the individual level. We’ve hypothesized that this is due to the fact that many players are not trained at the college level in the slot, and the transition from outside cornerback to the slot is not a trivial one even for professional football players.
While we have banged the drum for the value of coverage (it correlates with winning more than any other defensive facet we grade), it’s important to note that this comes with the results we’ve written today – that coverage from various positions (at least how we’ve measured them – through PFF grades and EPA) are not as stable season-to-season as other traits we’ve explored. We would argue that this means to throw more resources at the problem (i.e. the 2018 Philadelphia Eagles, who drafted two cornerbacks in the top three rounds and acquired two veterans before the season) and play the best players that emerge from the scrum. We are seeing this happening this offseason as well (e.g. the Chargers), and time will tell they can leverage this into fulfilling their lofty expectations as a team.

