We are now fully into the dull days of football, with free agency and the NFL draft fully in the rearview mirror. As such, it is high time to discuss some topics that have been on our collective minds while our favorite teams have made decisions about where to allocate capital. For example, half of the players in the first 10 picks of last month’s draft were defensive linemen, while it took until Pick 21 for a player from the secondary to be chosen, and it took until Pick 30 for a team to pick a cornerback. The Kansas City Chiefs decided to trade their first-round pick and a 2020 second-round pick to the Seattle Seahawks for Frank Clark, and then give him a five-year, $105-million deal. The Chiefs internally felt that Clark was worth the second-biggest contract among edge defenders, while many analysts, including us, were less bullish on the move, in our case because we value coverage very much relative to pass rush.
Really?
Coverage over pass rush? This seems to upend everything we think we know about football. For example, the league’s last defensive player to win league MVP, Giants Hall of Fame linebacker Lawrence Taylor, generated 20.5 sacks and propelled the 1986 Giants to a Super Bowl title the very year I was born. His crushing hits literally ended the careers of quarterbacks like Joe Theismann and struck fear in the eyes of both opposing players and fans. I don’t know about you, but for every Deion Sanders or Darrelle Revis, I seemingly remember the exploits of four or five elite pass rushers while growing up watching football.
Our perception that pass rush is king on defense is due to a few factors. First, the pass rush absolutely does affect the offense. In any measure, pass rush decreases not only the effectiveness of an offense but also our ability to reliably predict they and their quarterback’s effectiveness.
Second, the game has changed in substantial ways since many of us started viewing it. During the PFF era (2006-present) alone, first-down passes have increased from 47% of plays to almost 52% of plays. Time to throw and play- action percentages have gone down and up during this stretch, respectively, in many ways mitigating the effect that the pass rush can have on an offense. Passing plays are no longer just third-and-long, mano y mano battles between pass rushers and the offensive linemen trying to block them long enough for the quarterback to execute a deep drop and a 10-plus-yard completion.
Lastly, the way the game is broadcast has a big effect on the way we perceive the relationship between coverage and pass rush. Before that proliferation of All-22, we only saw the relationship between coverage and pressure in one direction – the pass rush affecting the integrity of a quarterback’s delivery and, in turn, enhancing the coverage on the back end. We are less inclined to view the other direction as equally meaningful – the one where the quarterback has to go to his second read gives the pass rush more time to get home, often further helping coverage.

Statistical Analyses
Narratives and anecdotes are fine and well, but let us explore what our data says. At PFF, we grade every player on every play of every game. Each play, a player is assigned a grade from -2 to 2, in increments of 0.5, and these are aggregated to fit on a 0-100 scale for consumers to use on Premium Stats 2.0. A positively-graded play for a pass rusher is usually (but not always) earned by generating a pressure and/or a sack on the quarterback, but is also earned when he beats his blocker on a quick throw where pressure is not possible. After normalization, a small negative grade is earned when he does neither of these things. Over the course of a game, a pass rusher needs to generate his fair share of pressure to earn a positive (above-average) grade.
For coverage men, a positive grade is earned by forcing an incompletion (either by intercepting or knocking the ball away or via forcing an overthrow or a throw out of bounds by limiting receiver separation), while negative grades are earned by being beat in coverage (whether or not the ball is caught).
I aggregated this data for each team by both taking the per-snap grade in each facet (pass rush and coverage) and the total grade earned in each facet. The former controls for volume while the latter does not, but both are useful due to the importance of both efficiency and volume in the game of football. I then scaled them onto a standard normal distribution so that both sets of variables had the same distribution.
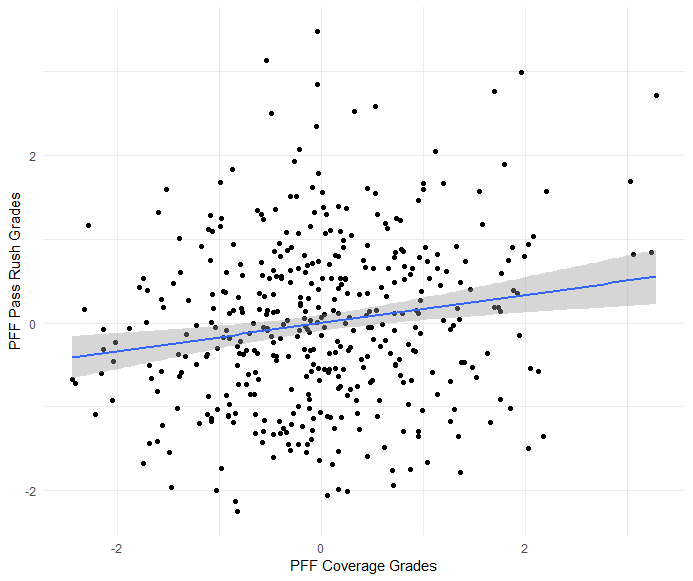
The first thing I wanted to know was whether PFF was able to measure pass rush and coverage at the team level independently. For the aggregate grades, the correlation between pass-rush grades and coverage grades at the team level is 0.17 (r-squared of 0.03). The correlation is similar, but a bit lower, on the per-snap level, but the conclusion here is that pass rush and coverage are correlated at the team level, but not by that much. Thus, trying to examine the two variables against each other isn’t the most egregious statistical endeavor in world history.
Stability
This is where the pass rush is going to win. At the player level, pass rushers with more than 400 snaps in consecutive seasons have pass-rush grades that correlate at a rate of roughly 0.62 (r-squared 0.38) for both per-snap and the aggregate level. On the other hand, coverage players with 400 snaps in consecutive seasons have coverage grades that correlate at a rate of roughly 0.34 (0.12) for both per-snap and the aggregate level. Thus, when it comes to buying into a player like an edge defender versus a cornerback, we’re (on average) a lot more likely to know that an edge is good or bad based on his previous work (as measured by PFF grades) than a cornerback. The same dynamic is true for teams – a team’s aggregate or snap-level pass-rushing grades are more stable season to season than coverage grades.
Reliability is not the same as value, however, which is why we have to study how grading well in each facet translates to team success.
Defensive Success as a Function of Pass Rush and Coverage
To study which of the two variables is “more important,” we look at how defensive success is affected by each. To do so, we use our expected points added (EPA) model, as well as its derived success rate (which is just a Boolean variable that is 1 when EPA > 0 and 0 when EPA < 0). These measures avoid some of the pitfalls associated with things like points allowed or yards allowed since not all yards and points are created or allowed equally.
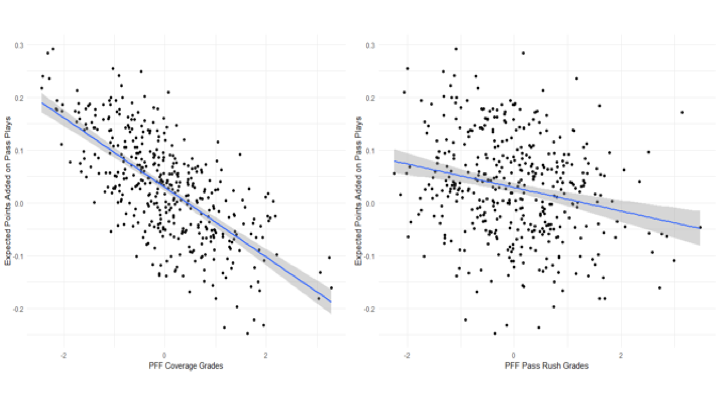
In isolation, the correlation between team-level coverage grades and EPA allowed per pass play during that season is roughly -0.69 (r-squared of 0.48). EPA correlates with pass rush at a rate of roughly -0.23 (r-squared of 0.05). The success rate is a bit less correlated with these grades (correlations of -0.62 and -0.21, respectively), but are directionally consistent with the above dynamic – PFF grades in coverage explain more about what happens in the passing game in a given season than pass-rush grades do.
Ok, but looking at what happened after the fact is not looking at the whole picture (we examined the same dynamic when looking at running back value earlier this offseason). We also want to know if coverage and/or pass-rush grades can predict team success in subsequent years. There are some confounders here, like players switching teams and/or teams switching schedules and schemes, but it’s useful to know that coverage in year n correlates with EPA allowed on pass plays in year n + 1 at a rate of roughly -0.26 (r-squared of 0.07), while pass rush is roughly uncorrelated with EPA allowed in subsequent years. Thus, while it is true that both at the player level and the team level pass rush is more stable than coverage season to season, the instability in coverage grades does not prevent them from having predictive power for future seasons.
For context, EPA allowed in the passing game is correlated season to season at a rate of roughly 0.34 (r-squared 0.11), demonstrating the substantial noise inherent in trying to predict quality of play on the defensive side of the ball, and how much team-level coverage ability (as measured by PFF grades – independent of roster and scheme changes) can account for the small signal within that vast amount of noise. A Pass rush’s inability to predict subsequent season success by opposing offenses is also tangentially consistent with our finding that clean-pocket passing performance is far more stable than pressured-pocket passing performance.
Conclusions
PFF coverage grades both explain and predict defensive success better than pass rush, but they come at the expense of year-to-year stability at both the player and team level. Next year’s Aaron Donald is likely to be Aaron Donald, but if a team is going to have a ton of success as a result of strong play by their defense, they will likely need to have next year’s Stephon Gilmore on their team (who is probably not going to be Stephon Gilmore himself). As I said on Kevin Cole’s podcast a few weeks back: during the PFF era, teams with elite coverage (67th percentile or better) and a poor pass rush (33rd percentile or worse) win, on average, about a game and a half more than teams with the reverse construction. Thus, is the correct conclusion that coverage > pass rush?
I think that it is more nuanced than this. For one, while what happens in coverage is indeed the definitive final step in most pass plays — the pass is complete or it is not, the tackle in the open field is made or missed — it’s also extremely reactionary. DeAndre Hopkins and Josh Doctson are two different players at the catch point, so a corner facing the former player two games a year in the AFC South is likely going to have fewer successful pass breakups than someone facing the latter player twice in the NFC East. Furthermore, these pass breakups are (on average) far higher-leverage actions than those in which Donald destroys a left guard on a quick pass to the outside. EPA gained by a passing offense is a great deal more stable year to year than that prevented by a defense (r = 0.48, r-squared = 0.23). So, as our friend Josh Hermsmeyer has said on Twitter, much of what happens to a defense is controlled by the performances of the offenses it faces in these high-leverage actions.
That our coverage grades have some predictive power in subsequent years is comforting, but the fact that pressure negatively affects offenses and is far more stable year to year leaves my stance far weaker than the “running backs don’t matter” stance that I hold so dear. What this work shows is that it is difficult to have a successful defense without players who can cover. While a pass rush certainly helps, offenses can scheme away from it pretty easily (a la the Patriots in the AFC playoffs) and readily exploit weaknesses in coverage if their quarterback is good enough to do so. Thus, would I have used substantial resources to buy the services of Frank Clark when my secondary was betting on two huge question marks at cornerback? Probably not.
However, I think this research falls short of saying “if you invest heavily in great secondary play, you will have a great defense,” for a few reasons. First, we’re not as good as we’d like to be (yet) at reliably identifying, year to year, who great coverage players are – as demonstrated by the stability analysis above. Coverage players who grade well one year are more likely to grade well the next year than those who do not, but the uncertainty is substantial. Second, and likely more importantly, your defensive success is largely a function of the offenses (and, more specifically, the quarterbacks) your team faces – something it has little control over even when sound personnel and scheme decisions are made. Playing off this second note is the simple fact that a coverage unit with one or two weak links may be a pretty bad coverage unit because an offense dictates where the ball goes while a pass rush requires less continuity.
So, we have ruled out the extremes of “get an elite edge first and at literally all costs” (I'm looking at you, Kansas City) and “only invest in the secondary, pass rushers don’t matter” (I'm looking at you, literally no one). What would be a good way to implement these findings? The instability but importance of coverage means that teams will have to take repeated chances to find collective brilliance there. We saw this, for example, with the 2017 Philadelphia Eagles, who after taking Derek Barnett (an edge) with their first-round pick, selected cornerbacks with their second- and third-round picks. They also signed Patrick Robinson and traded for Ronald Darby before the regular season, a year after signing safety Rodney McLeod from St. Louis. That one of their two draft picks missed a great deal of time (as did Darby) and they still had success underscores the instability in projecting coverage year to year but, more importantly, the importance of quality depth. The addition of Barnett to a front including Fletcher Cox, Brandon Graham and company helped what was always a good pass rush for the birds (second in PFF grades in 2016, first in 2017), but plus coverage (improving from 15th in 2016 to third in 2017) lifted them over the top.
Since 2008, the only two expensive, big-name free agents the Patriots have signed have been cornerbacks (Darrelle Revis and Gilmore), but they’ve also stocked up on unheralded players to play roles (e.g., Patrick Chung and Duron Harmon) while famously manufacturing pass rush with undervalued players. Additionally, when faced with two very tough pass rushes in the AFC playoffs in the Chargers and the Chiefs, Tom Brady’s time to throw was 2.18 seconds – by far the fastest in the NFL. The Chiefs were terrific at generating quick pressure in 2018, ranking fourth in pressure rate in less than 2.5 seconds, while the Patriots struggled in that metric, ranking 25th. However, the success of each pass defense is, of course, completely reversed: the Patriots ranked fifth against the pass (using EPA per pass play) while the Chiefs were 21st and felt the brunt of this incongruence on their home field in January.
Looking forward, the 2019 Tampa Bay Buccaneers, as we talked about on the PFF Forecast this week, took coverage players with their first four picks this year, after struggling to the second-worst EPA allowed per pass play last year. While it is unlikely that all four of these players will work out, the Bucs’ chances of having enough players play well enough for them to improve defensively are, by definition, higher (it’s also worth noting that they signed the underrated edge Shaquil Barrett this offseason). This was a sound sequence of moves for the Bucs, a team we like going into this season in an NFC South changing complexion.
That we are even open to this discussion is a great win for the open-mindedness of the community as a whole. That the initial conclusions upend some of our preconceived notions but leave a ton of space for new and existing data to be collected, analyzed, and interpreted, makes me excited for what’s next.

