There are many great questions that huwomankind (humantity) must solve, perhaps none more divisive than how to rank quarterback performance. Ask 10 people, and you will likely get 10 different lists. There are two major reasons for the diversity. First, each ranking values certain aspects of quarterback play which each ranker holds in high regard (who can forget the “QB Winz” cult that was just opined on in the Netflix docu-series “Wild Wild Country”). Secondly, the idea that we need to create a sequential list where the fourth-ranked player is definitively worse than the third-ranked player creates a great setting for unlistenable debate, but little in the way of functional use. While there is certainly a need for the all-in-one number, when evaluating quarterback play, there are simply too many facets to let the conversation stop there.
Our method takes a different approach. Instead of starting with the differences, we let the similarities tell us where to draw the line. Instead of deciding that a certain data point is meaningful, we let mathematical signal decide which truly matter. As we dicsussed on last week’s edition of the PFF Forecast, the method of quarterback performance clustering allows for less division and more contructive discussion.
What is Clustering and why do we use it
Clustering is a mathematical method that seeks to create groupings of observations that are similar. While it is not hard to look at a single variable, say touchdown-to-interception ratio, and group quarterbacks based on that one number, we have slightly higher aspirations. We know there are many different numbers needed to adequately summarize a quarterback’s performance and clustering allows us to create groups of players based on as many different variables as we want. The k-means clustering algorithm (though there are many other methods this is by far the most widely used) finishes its iterative process when each quarterback is in a cluster that most accurately represents that quarterback – in other words there is no other cluster whose center (or mean of all the different variables) is closer to that quarterback than the cluster he is currently in.
Each cluster can be described by the mean values of each variable thereby allowing us to compare and contrast clusters and thereby characterize the quarterbacks within them. This divorces us from the need to say ‘A' is better than ‘B.' In fact, we may (and do) conclude that two clusters are not necessarily better but rather different and those differences may vault one over the other depending on the specific team or fan. As we did in great detail in our inaugural PFF QB Annual, we will take a quick look at some of our processes and their subsequent results over the next few paragraphs.
How do we choose the variables
When doing any multivariate analysis, it’s important to select the right subset of the variables available to you at the time. When it comes to quarterbacks, we wanted variables that were stable, that correlated with success (with respect to Expected Points Added) and captured some element of “style” of play.
To the first point, we found that, among the variables we considered, the percentage of negative PFF graded plays per dropback, overall PFF grade per dropback, percentage of -0.5 PFF graded plays per dropback and percentage of +0.5 PFF graded plays per dropback were the most stable season-to-season if you consider all quarterbacks from 2006-2017 with at least 200 dropbacks in consecutive years (n = 285). If the threshold of 200 dropbacks changes, these (slightly) change, but the qualitative conclusions are the same. For context, yards per attempt is similarly stable as completed air yards per attempt (a measure of style of play), the percentage of +0.5 PFF grades and turnover-worthy play percentage. Big-time throw rate is the least stable among our variables.

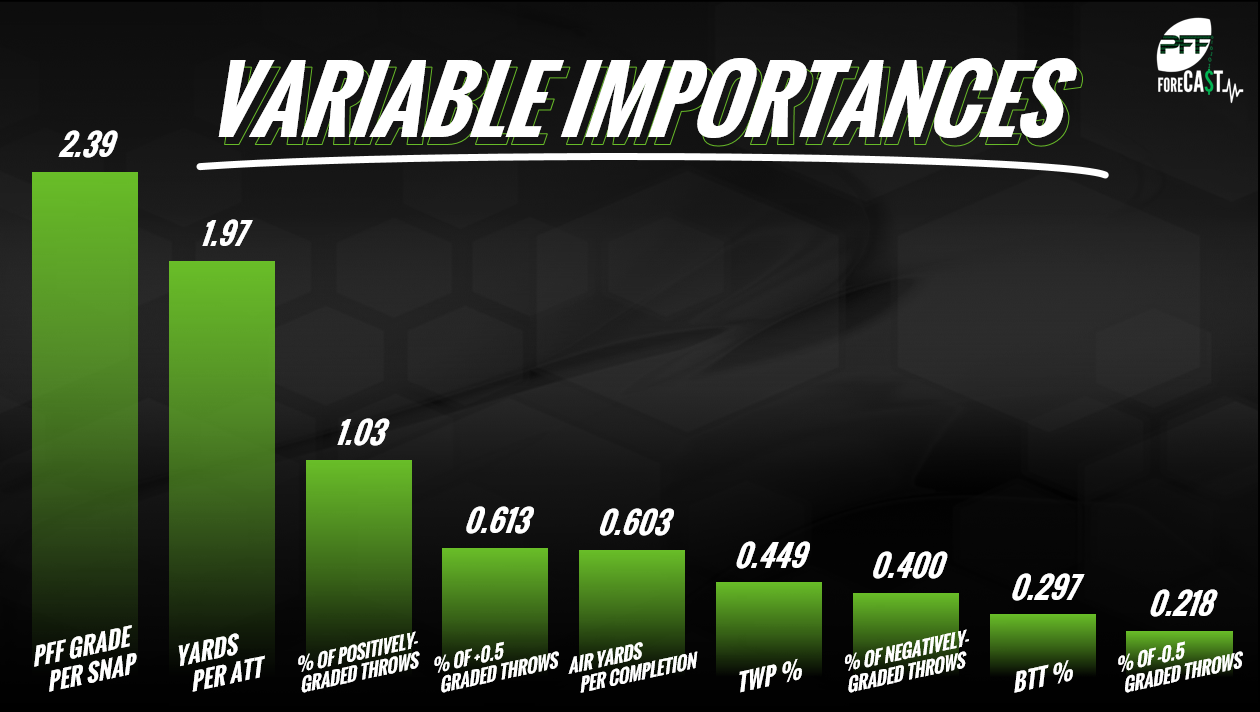
When it comes to value, however, yards per attempt (along with PFF grade per snap) shows it belongs in any quarterback evaluation tool by showing up in every attempt we’ve used to measure how the variables we're using map to the average Expected Points Added generated by a quarterback in a given season per play. In terms of variable importances, PFF grade per snap, yards per attempt and percentage of positively-graded throws are the most-important variables, while the percentage of negatively-graded throws are the least important. Thus, while a quarterback’s penchant for negatively-graded plays is his most-stable trait, the rate at which he generates plus-graded plays moves the lever for his team (and likely our perception of his play) the most.
The interplay between what is stable (grade per snap, negative grades generated per snap) and what is valuable (grade per snap, positive grade per snap, yards per attempt) underscores how important it is to incorporate the right information in any evaluation of quarterback play.
What do the clusters look like
We ended up with six clusters, the full composition of which can be found in the inaugural PFF Quarterback Annual. Each cluster can be described relatively easily via a tier and/or a style. For example, Cluster 1 is the cluster of truly elite quarterbacks, while Clusters 2 and 3 are players that were second-tier in a given season, Clusters 4 and 5 were third-tier guys and Cluster 6 were the quarterbacks who played poorly that year. Clusters 2 and 4 were of the “safer” variety (fewer BTT and TWP, shorter depths of completion), while 3 and 5 were “riskier” players.
While the full list of quarterbacks and their clusters (even historically) can be found in the annual (and the clusters for 2017 found in the graph below), we provide a prototype for each of the clusters:
Cluster 1: Tom Brady
Brady has reached the highest level of quarterback play and proven to the be the paragon of elite quarterbacking. The top cluster of quarterbacks are what we consider Tier 1 quarterbacks and are the guys who set the table for the success of their supporting casts instead of being dependent on them. Brady was the only quarterback to rank in the top five in both big-time throw rate and turnover-worthy play avoidance. Brady led the league in expected points added per dropback and exemplified the Tier 1 quarterback in the AFC championship against the great Jacksonville Jaguars defense without the services of Julian Edelman and Rob Gronkowski.
Cluster 2: Alex Smith
Smith had a terrific year in 2017, leading the league in passer rating and generating 200 more yards than any other quarterback on passes traveling more than 20 yards in the air. Be those as they may, on a per-dropback basis, he produced turnover-worthy plays at a rate that was less than every quarterback in the league except Matt Ryan and Tyrod Taylor, steering him (again) into the “safer” category. His fifth-highest big-time throw rate was still less than you’d expect from a player with such success throwing downfield, demonstrating the value of our play-by-play grading system in lieu (or in complement with) traditional statistics. A Cluster 4 quarterback in his previous four years in Kansas City, it will be interesting to see where he ends up in Washington.
Cluster 3: Deshaun Watson
Many will jump to Watson’s outrageous touchdown total as evidence of his high ceiling. A better measure of his high-end play is his league-best big-time throw percentage. Cluster 3 quarterbacks are characterized by a high-rate of great plays as well as a propensity for negative plays and Watson ranked just 33rd in avoiding turnover-worthy plays last season. Watson was not nearly as polished a quarterback as his box-score numbers would suggest, on plays where he had to go to his 2nd or 3rd look, he earned the second-lowest PFF grade and accuracy percentage and the third-worst rate of turnover-worthy plays. Improvement in these areas could spell a trip into elite status in due time and his play from a clean pocket post the Week 1 debacle was extremely encouraging, but for now it provides a bit of caution for a quarterback coming off of injury in his second season.

Cluster 4: Joe Flacco
While a plurality of Super Bowl-winning quarterbacks have been of the Cluster 1 variety since 2006, Flacco’s 2012 season was of the Cluster 3 variety. He’s evolved since then, dropping down a tier and from the riskier clusters into a safer one (where he’s been since 2015). While his supporting cast was certainly something to behold a season ago (with his receivers generating the lowest and highest rates of positively-graded and negatively-graded plays in 2017, respectively), Flacco deserves a decent amount of the blame for his lack of production, generating accuracy numbers well below average in both the 10-19 yard range and the 20-plus yard range. Thus, even with average-to-good receivers, the results would still have left Baltimore Ravens fans wanting to exclaim “nevermore” and turn their attention to the 32nd-overall pick from Louisville.
Cluster 5: Cam Newton
Cam Newton showing up in Cluster 5 is going to shock some. Before you curse us into oblivion, it is worth remembering that rushing is not a component of quarterback performance that we are considering for this iteration. Designed quarterback runs are a positive-expected-value play and Newton averaged more yards per carry than all players with 100-plus carries except Alvin Kamara. Newton ranked 32nd in big-time throw rate and 31st in grade from a clean pocket. He didn’t make nearly enough big throws, and was league average in avoiding negative ones. His accuracy was simply not there as well, as he overthrew 9.9 percent of his targets (highest in the league) and had the sixth-highest rate of uncatchable throws.
Cluster 6: Jay Cutler
The seemingly-retired Cutler is an interesting case study. His statistics were not great a season ago, no matter how you slice it. However, a passer rating of 80.8 and a touchdown-to-interception ratio of 19/14 is not extremely offensive at first blush. It’s only after you replace touchdowns with BTT and interceptions with TWP where you see Cutler’s true difficulties. He was just 41st in generating big-time throws, while being similarly poor at avoiding turnover-worthy plays. His PFF grade generated from a clean pocket was such that he ended up in Cluster 6 in that environment as well, and the stability of that data suggests that what we saw was truly the end for Smokin’ Jay and not a mere blip on the radar screen.
With a few examples in tow, we can visualize the cluster composition in 2-dimensional space by reducing aforementioned variables into their principal components using Principal Component Analysis or PCA. While these principal components do not contain all of the variance, they do capture the majority of the variance (47 percent for the first component plotted on the x-axis and 27 percent for the component plotted on the y-axis). This allows us to see a great deal of the cluster segmentation.
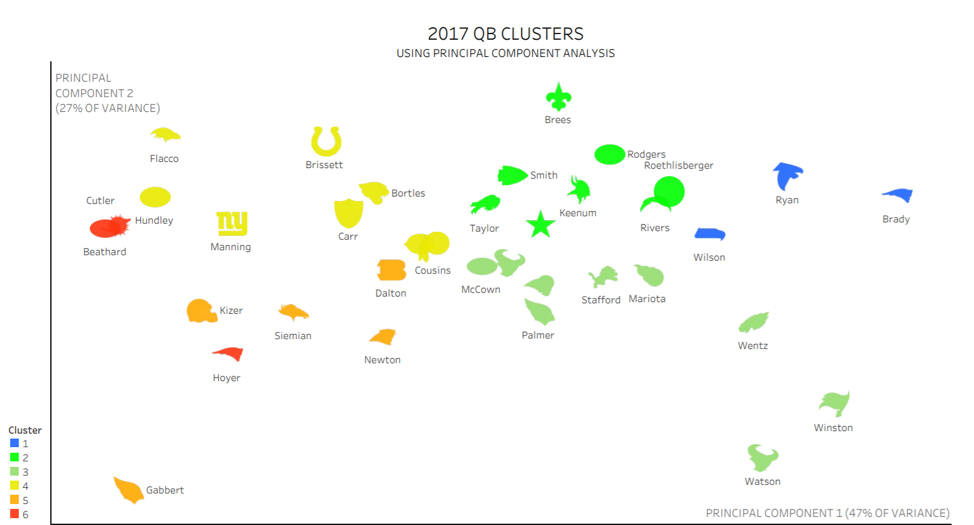
PFF 2017 QB Clusters using principal component analysis. Due to sample size limitations Jimmy Garoppolo is not shown, though this could also be simply because such divinity can’t be captured by earthly values.
Conc-LOU-sion
Quarterback clustering has allowed us to improve the way we talk and evaluate quarterback play. And off the back-end of this work, we have created supporting cast performance clusters to add context to quarterback performance (we discuss the relevance of this with Kirk Cousins and Alex Smith in Episode(s) 23 and 26 of the PFF Forecast), as well as scheme clusters to account for what a quarterback is asked to do. Even after adding more context to the picture, we still see these analyses as a first and rudimentary step. With the new pieces of data that we are collecting, we are creating new ways to evaluate quarterbacks on a throw-for-throw basis with what we are calling ‘NFL Throws.' Taking this into account, we anticipate this study to help us link college and pro performance in a more meaningful and predictive way.
To hear about all the newest studies and research be sure to subscribe and listen to the PFF Forecast each Wednesday.

