 One problem with statistics in all of sports is that there are never two instances that are exactly the same. We can try to account for as many factors as we possibly can, but we will never be perfect. We can only strive to improve.
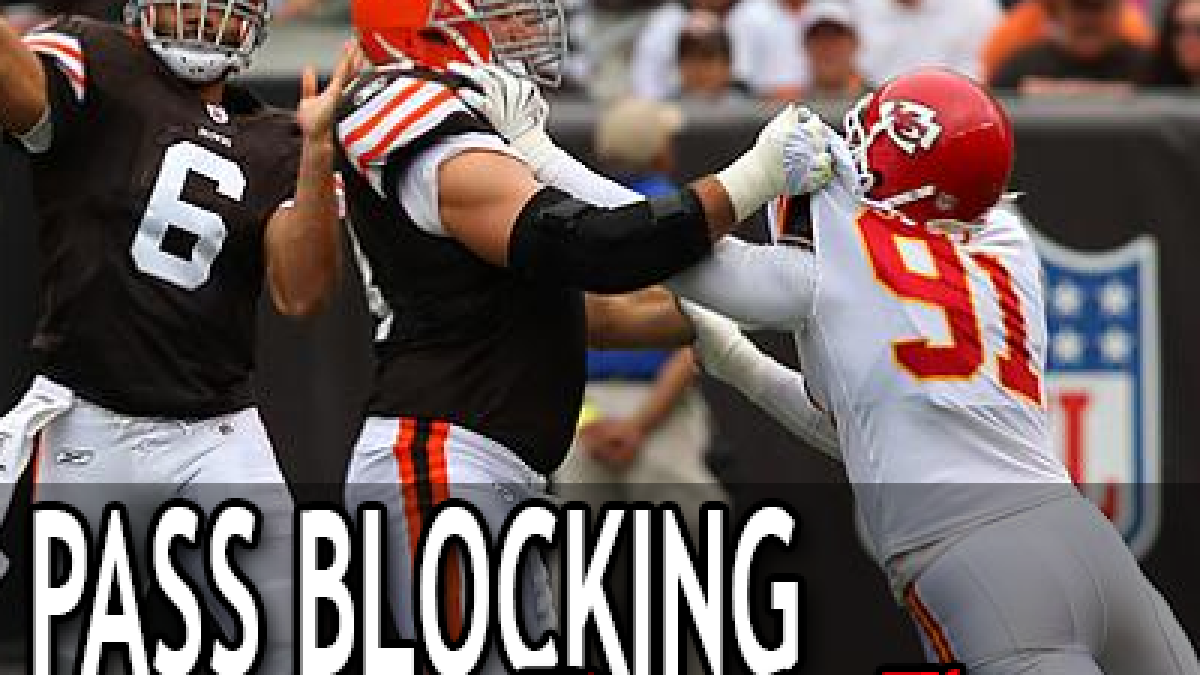
This concept holds true for pass protection. If a team’s offensive philosophy was to throw screens and quick slants every pass play, then it would make life for the offensive linemen relatively easy.
If that was the philosophy, we could see that the team’s linemen never allow pressure over the entire season. On the other hand, if the quarterback decided to hold onto the ball for four seconds every play, then even the best offensive linemen would allow pressure on a somewhat consistent basis.
Our grades are able to account for how long the quarterback holds onto the ball, but our raw pressure numbers do not — one of the many reasons we prefer our grades to any statistic. While it is great to get an overall view of how good pass blockers are, it would be even better to level the playing field and see how pass rushers perform in certain situations.
For example, let’s say an offense always throws the ball at exactly two seconds after the snap on their passing plays. It’s not a realistic model, but it would be interesting to know how good offensive linemen are at pass blocking within the first two seconds of a play and we can get fairly close to a definitive answer using PFF data.
Looking at the 2013 season, we can start with every pass block by a player during the season, what the time to throw was, what the time to pressure was, and if any pressure was allowed. Any play where the ball was thrown before two seconds and an offensive lineman didn’t allow pressure is taken out of the data set. Any play where an offensive lineman allowed pressure after two seconds would be considered ‘no pressure allowed' because it came after the two-second mark in that scenario.
2.0 Seconds
Here is a table of the top tackles, guards and centers in terms of Pass Blocking Efficiency (measuring sacks, hits, and hurries against the number of snaps spent pass blocking with weighting heavier toward sacks) at 2.0 seconds. This data includes the playoffs, and requires a minimum of 100 pass rushes remaining in the data set to qualify for the list.
Offensive tackles:
| Pos | Name | Team | Pass Blocks | Sacks | Hits | Hurries | PBE |
| OT | Joe Thomas | CLV | 604 | 0 | 0 | 1 | 99.88 |
| OT | Jordan Gross | CAR | 459 | 0 | 0 | 2 | 99.67 |
| OT | Tyler Polumbus | WAS | 505 | 0 | 3 | 2 | 99.26 |
| OT | Terron Armstead | NO | 132 | 1 | 0 | 0 | 99.24 |
| OT | Michael Oher | BLT | 486 | 0 | 1 | 4 | 99.23 |
| OT | Jason Peters | PHI | 482 | 0 | 1 | 4 | 99.22 |
| OT | Byron Bell | CAR | 454 | 0 | 1 | 4 | 99.17 |
| OT | Zach Strief | NO | 547 | 1 | 0 | 5 | 99.13 |
| OT | Demar Dotson | TB | 459 | 1 | 0 | 4 | 99.13 |
| OT | Trent Williams | WAS | 506 | 2 | 2 | 2 | 99.01 |
Guards:
| Pos | Name | Team | Pass Blocks | Sacks | Hits | Hurries | PBE |
| G | Chris Scott | CAR | 218 | 0 | 0 | 0 | 100.00 |
| G | Brian Waters | DAL | 151 | 0 | 0 | 0 | 100.00 |
| G | Andrew Whitworth | CIN | 139 | 0 | 0 | 0 | 100.00 |
| G | Ronald Leary | DAL | 456 | 0 | 0 | 2 | 99.67 |
| G | Josh Sitton | GB | 399 | 0 | 0 | 2 | 99.62 |
| G | Ben Grubbs | NO | 588 | 0 | 1 | 2 | 99.62 |
| G | Willie Colon | NYJ | 436 | 1 | 1 | 0 | 99.60 |
| G | Mike Brisiel | OAK | 370 | 0 | 0 | 2 | 99.59 |
| G | Louis Vasquez | DEN | 518 | 0 | 0 | 3 | 99.57 |
| G | Rob Sims | DET | 461 | 0 | 0 | 3 | 99.51 |
Centers:
| Pos | Name | Team | Pass Blocks | Sacks | Hits | Hurries | PBE |
| C | Jason Kelce | PHI | 503 | 0 | 0 | 0 | 100.00 |
| C | John Sullivan | MIN | 421 | 0 | 0 | 0 | 100.00 |
| C | Kevin Boothe | NYG | 205 | 0 | 0 | 0 | 100.00 |
| C | Nick Mangold | NYJ | 437 | 0 | 0 | 1 | 99.83 |
| C | Roberto Garza | CHI | 457 | 0 | 0 | 2 | 99.67 |
It probably isn’t surprising to find Joe Thomas at the top of the list with just one pressure allowed within the first two seconds. It is yet another number to show how dominant of a left tackle he has been since joining the NFL. Some of the more surprising names are Terron Armstead who allowed his fair share of pressure in his four starts but performed admirably in the first two seconds of plays.
Michael Oher is another to note. He allowed 57 pressures on the year but could be excited for the upcoming season as Jake Locker has typically shown a lower average Time to Throw (TTT) than Joe Flacco.
At guard there were three perfect players. It’s important to note that this only includes Andrew Whitworth’s time at guard and not at tackle. If you were asked to name Cowboys offensive players, the guards might be the last two players listed. However, they were excellent in protecting Romo for his first two seconds of drop-backs.
The list of centers isn’t all that different from our typical list of top pass-blocking centers. The most noteworthy player is Kevin Boothe who was a noticeably better pass blocker at center than he was at left guard.
There are a few problems with analyzing players in this way. If a player is successfully pass blocking for 1.9 seconds and the ball is thrown, chances are they would have been able to successful for that extra tenth of a second but we didn’t include it. However, it does count every time a player did allow pressure within 1.9 seconds. Therefore this kind of analysis will underestimate how good a player is in pass protection because it always accounts for the bad plays of less than two seconds, but sometimes eliminates the potential good.
2.5 Seconds
If we did this analysis for a number lower than two seconds, then we get closer to most linemen allowing no pressure. However, if we increase the time threshold we get more interesting results. Here are the top linemen when we look at the 2.5-second mark:
Offensive tackles:
| Pos | Name | Team | Pass Blocks | Sacks | Hits | Hurries | PBE |
| OT | Jordan Gross | CAR | 309 | 2 | 1 | 6 | 97.65 |
| OT | Joe Thomas | CLV | 421 | 0 | 3 | 17 | 96.44 |
| OT | Tyler Polumbus | WAS | 289 | 3 | 5 | 9 | 95.33 |
| OT | Joe Staley | SF | 262 | 3 | 2 | 11 | 95.13 |
| OT | Demar Dotson | TB | 291 | 3 | 1 | 14 | 95.10 |
| OT | Zach Strief | NO | 354 | 4 | 2 | 16 | 95.06 |
| OT | Sebastian Vollmer | NE | 106 | 0 | 1 | 6 | 95.05 |
| OT | Tyron Smith | DAL | 270 | 0 | 1 | 19 | 94.44 |
| OT | Russell Okung | SEA | 144 | 2 | 3 | 5 | 94.44 |
| OT | Jason Peters | PHI | 328 | 2 | 4 | 19 | 94.13 |
Guards:
| Pos | Name | Team | Pass Blocks | Sacks | Hits | Hurries | PBE |
| G | Willie Colon | NYJ | 282 | 1 | 2 | 5 | 97.78 |
| G | Chris Scott | CAR | 146 | 1 | 1 | 2 | 97.77 |
| G | Josh Sitton | GB | 228 | 0 | 0 | 7 | 97.70 |
| G | Louis Vasquez | DEN | 265 | 0 | 0 | 9 | 97.45 |
| G | Ben Grubbs | NO | 369 | 2 | 3 | 8 | 97.22 |
| G | Jahri Evans | NO | 330 | 1 | 2 | 11 | 96.74 |
| G | Evan Mathis | PHI | 339 | 2 | 5 | 8 | 96.53 |
| G | Travelle Wharton | CAR | 267 | 0 | 0 | 13 | 96.35 |
| G | Larry Warford | DET | 240 | 0 | 5 | 7 | 96.25 |
| G | Jamon Meredith | TB | 122 | 0 | 2 | 5 | 95.70 |
Centers:
| Pos | Name | Team | Pass Blocks | Sacks | Hits | Hurries | PBE |
| C | Roberto Garza | CHI | 267 | 0 | 0 | 5 | 98.60 |
| C | Jason Kelce | PHI | 330 | 2 | 0 | 4 | 98.48 |
| C | Nick Mangold | NYJ | 279 | 0 | 1 | 5 | 98.39 |
| C | Scott Wells | SL | 180 | 1 | 0 | 3 | 98.19 |
| C | Max Unger | SEA | 196 | 1 | 0 | 4 | 97.96 |
The first thing worth noting here is just how big of a difference half of a second makes. Quite a few of the names remain the same, but the amount of pressure allowed increased while the Pass Blocking Efficiencies decreased.
This list also resembles our normal Pass Blocking Efficiency numbers more closely. It is expected for the average to above average players to very rarely give up pressure within two seconds so one single play could make a noticeable difference on the leaderboard. Here we see more of a difference between one player and another.
3.0 Seconds
Finally, here is the same analysis done but with a three-second threshold. Anything beyond three seconds, we find that the sample size starts to get too small.
Offensive tackles:
| Pos | Name | Team | Pass Blocks | Sacks | Hits | Hurries | PBE |
| OT | Joe Thomas | CLV | 203 | 2 | 7 | 25 | 87.19 |
| OT | Demar Dotson | TB | 151 | 4 | 2 | 21 | 85.93 |
| OT | Jason Peters | PHI | 181 | 3 | 4 | 26 | 85.91 |
| OT | Zach Strief | NO | 182 | 4 | 4 | 26 | 85.44 |
| OT | Jordan Gross | CAR | 154 | 6 | 3 | 19 | 85.39 |
| OT | Joe Staley | SF | 129 | 4 | 4 | 16 | 85.27 |
| OT | Branden Albert | KC | 115 | 3 | 6 | 13 | 85.00 |
| OT | Tyler Polumbus | WAS | 166 | 3 | 8 | 23 | 84.19 |
| OT | Trent Williams | WAS | 164 | 8 | 5 | 19 | 84.15 |
| OT | Tyron Smith | DAL | 137 | 1 | 2 | 26 | 83.94 |
Guards:
| Pos | Name | Team | Pass Blocks | Sacks | Hits | Hurries | PBE |
| G | Josh Sitton | GB | 112 | 1 | 0 | 8 | 93.75 |
| G | Willie Colon | NYJ | 132 | 1 | 2 | 10 | 92.42 |
| G | Evan Mathis | PHI | 182 | 2 | 5 | 12 | 91.90 |
| G | Jahri Evans | NO | 170 | 3 | 2 | 16 | 90.29 |
| G | Ben Grubbs | NO | 187 | 3 | 5 | 17 | 89.57 |
| G | Louis Vasquez | DEN | 100 | 0 | 2 | 12 | 89.50 |
| G | Travelle Wharton | CAR | 127 | 0 | 3 | 15 | 89.37 |
| G | Kory Lichtensteiger | WAS | 152 | 2 | 3 | 18 | 88.32 |
| G | J.R. Sweezy | SEA | 140 | 0 | 4 | 20 | 87.14 |
| G | James Carpenter | SEA | 105 | 4 | 4 | 9 | 86.90 |
Centers:
| Pos | Name | Team | Pass Blocks | Sacks | Hits | Hurries | PBE |
| C | Jason Kelce | PHI | 171 | 2 | 1 | 5 | 96.20 |
| C | Max Unger | SEA | 116 | 2 | 0 | 5 | 95.04 |
| C | Brian De La Puente | NO | 176 | 3 | 2 | 9 | 93.61 |
| C | Stefen Wisniewski | OAK | 113 | 0 | 2 | 9 | 92.70 |
| C | Nick Mangold | NYJ | 133 | 0 | 1 | 12 | 92.67 |
Here we see the sample sizes decrease a bit, as in order for a play to count either the quarterback needed to hold onto the ball for three or more seconds, or the offensive linemen needed to allow pressure within those first three seconds.
If a team’s plan is to have a lot of quick passes, then the numbers on this table aren’t very important. However if the playbook calls for a play to develop down field then these become incredibly important.
A lot of the players on the leaderboard came from teams with a high average time to throw. A team like Seattle had to deal with a weak point on the offensive line mostly due to their run blocking, but their interior pass blocking was above average considering their time to throw. Teams like Philadelphia, Carolina, San Francisco, Tampa Bay, Washington and the New York Jets also had high time to throws and have an offensive lineman represented on the list.
While this type of analysis certainly isn’t perfect, it gives a decent idea of when pressure is allowed in the NFL, which players have a strength in pass protection, and how important fractions of a second are. Knowing how much pressure is given up is certainly a much better indicator of how good an offensive line is than looking at just sacks given up. In order to get that better indication, though, the time to throw and time to pressure needs to be accounted for.
Follow Nathan on Twitter: @PFF_NateJahnke
![]()
