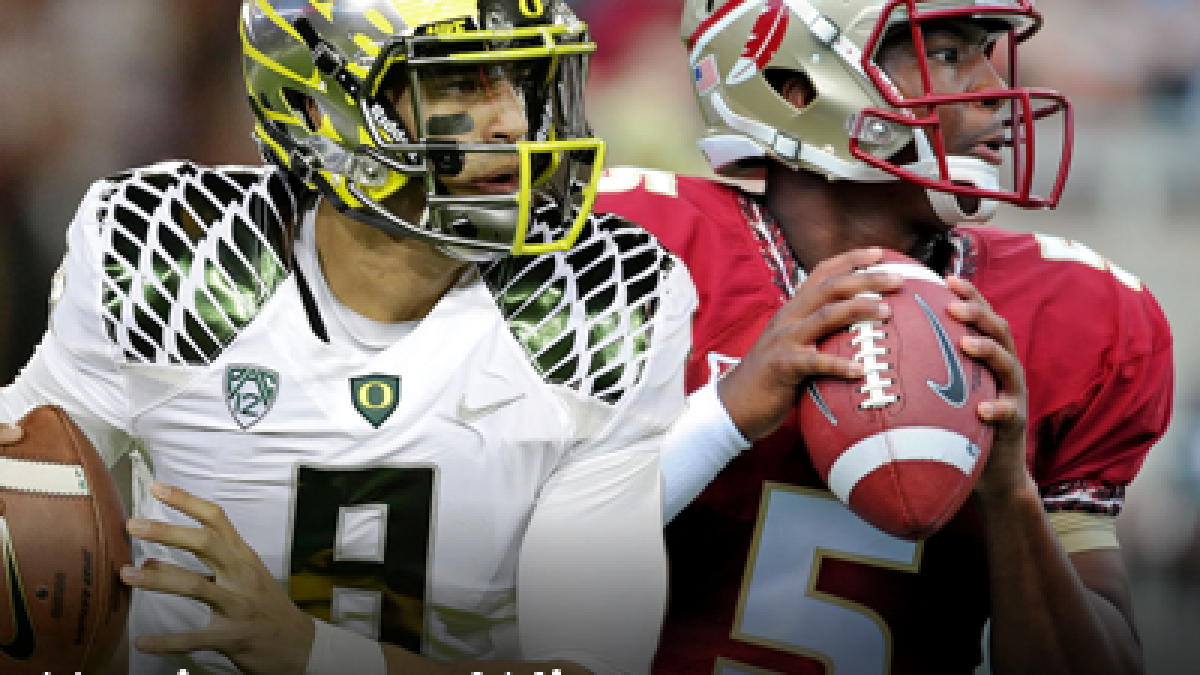
 The new College Football Playoff has presented us with a great matchup of two of the last two Heisman Trophy winners as Oregon’s Marcus Mariota squares off against Florida State’s Jameis Winston on New Year’s night at the Rose Bowl. At PFF we’ve been diving into the college game this season so what better way to preview the game than by looking at two of the nation’s best quarterbacks? Not only are Mariota and Winston excellent college players, they’re both expected to become top picks in the NFL Draft. Here’s a look at how the two quarterbacks shaped up with regard to stats and grades.
Note: * All grades are normalized by situation, meaning they’re graded in comparison to other college quarterbacks in a similar situation.
Overall
We have to start with the caveat that Mariota and Winston play in completely different systems so it’s not always apples to apples when comparing them. That said, as always, the PFF grades take into account the quarterback’s actual contribution on each play by evaluating their decision making, throw location, throw difficulty, and everything else that goes into a given play. Here’s a broad look at Mariota and Winston this season.

Under Pressure
The first thing that stands out is that Mariota has attempted about half as many passes as Winston when pressured. Both players have performed fairly well, but Mariota’s +12.5 grade and 11.7 yards per attempt stand out. Winston held his own, particularly given the unrest at the center position throughout the season. Prior to an offensive line overhaul in Week 12, Winston faced pressure through the center on 30 drop-backs, and as we’ve shown in the past, pressure through the A-gap is the worst kind of pressure for a quarterback.

No Pressure
Most quarterbacks post gaudy stats from a clean pocket and Mariota and Winston are no different. With the stats are solid for both, Winston’s interception totals stand out and some of those poor decisions drag his grade down to only +9.1.

vs. Blitz
Another difference in how teams approach the two quarterbacks, Mariota only faced the blitz on 24% of his snaps while Winston was blitzed 36% of the time. Mariota’s numbers are good again, but Winston actually has the better grade. This is in part because he’s had a higher number of opportunities, but when comparing the stats and the grades, Winston has obviously had some bad luck that has led to his nine interceptions. For the most part, he’s done a nice job of getting the ball out and finding his playmakers against the blitz.

No Blitz
Opposing teams have generally sat back and played coverage against Mariota and it hasn’t worked well. He threw 27 touchdowns and no interceptions while averaging 10.5 yards/attempt. Winston actually struggled a bit more against a traditional rush.

Play Action
Perhaps the best stat that shows the difference in Oregon’s offense compared to Florida State and even a traditional NFL offense, Mariota used play action on 51% of his drop-backs. By comparison, in the NFL, Alex Smith led the league with 31% and Winston only uses play action 16% of the time. Mariota’s numbers are exceptional, but the grade sitting at only +5.5 shows that the play action game has led to some easier throws that have looked great on the stat sheet.

Rollouts
The one area where both players have actually struggled is on designed rollouts. Mariota is obviously known as a very athletic quarterback, but when Oregon has rolled him out, he’s grading at -2.2. Winston’s results have been similar and he’s only been asked to roll out half as often.

Scrambles
A different animal from designed rollouts, these plays include any time the quarterback has left the pocket and scrambled left or right while throwing. Mariota performs better in these impromptu situations at +5.5, but it’s interesting to note, that despite his athleticism, he plays most of his game from the pocket. Only 31 of his 375 attempts have come on these broken plays.

Running Game
*Important (glorious) note: At PFF, we do NOT count sacks as negative rushing yards as does the NCAA, so rushing totals will not match traditional NCAA statistics.
Obviously Oregon uses Mariota as a designed runner as a big part of their offense and he has been extremely good in that area, picking up 528 yards on 52 designed runs. He’s done well as a scrambler as well, adding 196 yards on 25 carries. Winston is not used as a runner very often and he picks his spots when scrambling, but he’s had some key runs this season on his way to 150 yards on 21 carries. Given their reputations, it may be surprising to see a similar number of scrambles for both quarterbacks. (click to enlarge)


By Route
The route chart speaks for itself, Winston has relied heavily on out routes, hitches, crossing routes and passes to the running backs on non-screens, while Mariota has thrown quite a few WR screens while putting up gaudy numbers on post routes.


Passing Charts
Again, the visual speaks for itself. Winston has made some of his questionable decisions on throws down the field while Mariota has graded extremely well on passes to the intermediate and deep ranges. The question about the Oregon offense is how many of those throws were made into tight coverage. (click to enlarge)

 Big Throws vs. Risky Throws
It may not be the best way to describe the throws, but the beauty of the PFF grading system is the ability to separate the various types of throws each quarterbacks makes. For lack of better terms, the “big throws” are the highest-graded throws when factoring in difficulty of the throw and ball location while the “risky throws” are those which are deemed as poor decisions or poor enough ball location that they should become turnovers, regardless of whether or not they were intercepted.
The further to the right on the chart, the higher percentage of big-time throws while the higher up on the chart, the lower the percentage of risky throws. We’ve included some NFL comparisons from this year just to show where each quarterback stacks up. The upper right of the chart is the desired area (high percentage of big throws/low risky throws) while the upper left is more of a safe region (think Alex Smith), while the lower right is more of a high risk/high reward region (think Andrew Luck) and the lower left is the worst place to be.
Here’s a look at Mariota and Winston in this context (click to enlarge):

*Important to remember this is just a small percentage of throws and only represent the extreme ends of the grading spectrum. It is a good way to measure the risk/reward nature of a player's performance.
Follow Steve on Twitter.
![]()

