 This article was written in tandem with Ryan McGlothlin, who has spent the past two years developing a system for evaluating which NFL Draft Combine (and pro day) data most effectively predicts a player’s likelihood of NFL success.
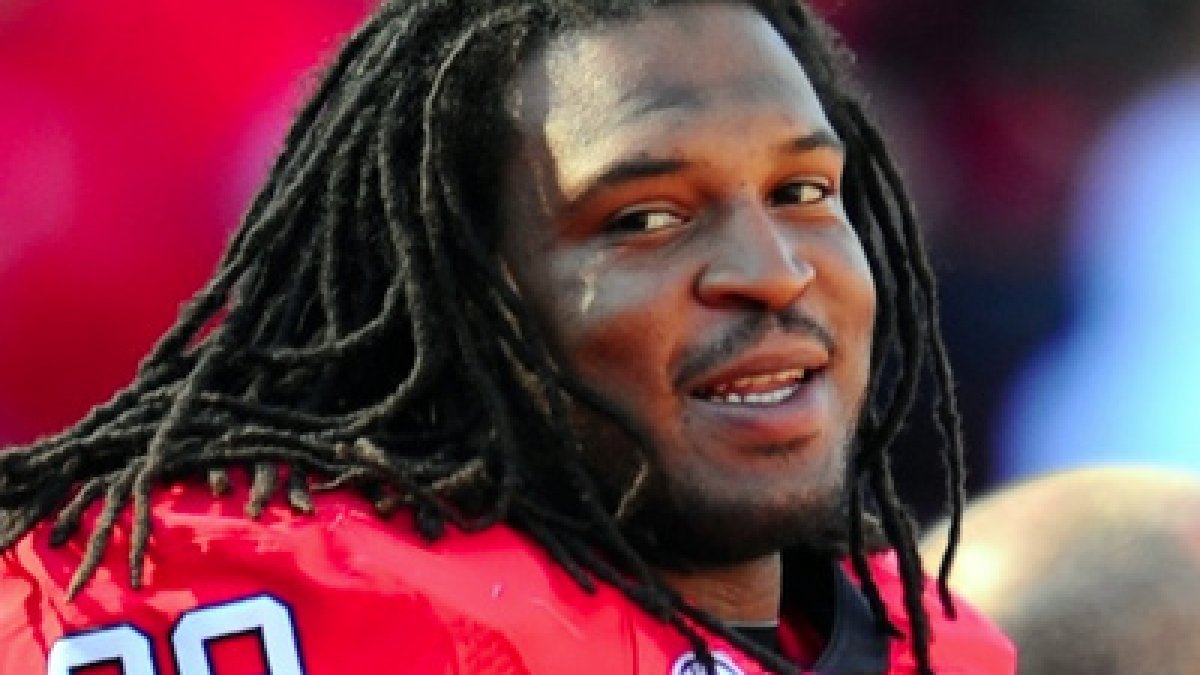
Jarvis Jones was drafted 17th overall by the Steelers and was the second 3-4 OLB selected after Barkevious Mingo. Jones was a key part of a very good Georgia defense, which saw four players selected in the first three rounds of the 2013 draft.
He was considered by many to be a top-10 pick prior to his Pro Day given his productivity in college and his perceived athletic ability. This changed at the Pro Day when he ran a poor 40 time (4.88 seconds), and had poor vertical/broad jumps and very poor 3-cone and 20-yard shuttle times.
Since that time, Jones’ proponents have pointed to his terrific college-level production and compared him to another AFC North star – Terrell Suggs – who also failed to impress at the combine (4.84 40-yard dash), drawing the specious conclusion that Jones would be “the next Suggs.” As we’ve often seen with player comparisons (see: Watt, J.J.) they’re often grounded in biased predisposition rather than careful analysis. Perhaps Jones will go down as the next Suggs, but for him to do so would make him a severe outlier. In other words, this is the kind of pick that can only safely be made by a GM/coach with a high level of job security (see: Colbert, Kevin and Tomlin, Mike).
We have evaluated Jones’ athletic measurables as compared with others who have gone through the Combine and played in the NFL since 1999 (the year that Combine/Pro Day statistics are publicly available). We have created position-specific algorithms, based solely on a player’s athletic measurables, that helps to predict NFL success as measured by a player’s Career Approximate Value, as developed and tracked by Pro-Football-Reference.com, divided by a player’s years in the league. The algorithm produces a Success Prediction Score or SPS. We then adjust the SPS by a player’s draft position in order to provide an even more accurate prediction of future success, and find this particularly important for fantasy football (as fantasy players have the benefit of seeing where a player was actually drafted as well as the athletic performance).
For 3-4 outside linebackers (or smaller 4-3 DEs that could play either position), the NFL draft is a particularly poor predictor of success, with only a 45% correlation between draft position and average Career Approximate Value. Our raw SPS has a 54% correlation with ultimate success, so it is already meaningfully better than the draft alone. Adjusting SPS by a player’s draft position increases the correlation to over 55%. In many ways the 3-4 OLB epitomizes the “boom-bust” of the NFL Draft – about half of the first round picks at the position have found success in the past decade, and about half have not. This can be seen clearly in the chart below.
The correlation and R-squared of the chart above shows the relatively loose relationship between draft position and success. The chart below shows the same data set, but ranking players based purely on their SPS.
We have shown the rankings of several players who are outliers, good and bad. Aaron Maybin had the worst SPS score of any 1st rounder since 1999 (-1.34 vs. average of 0 and median of .26), and has been pretty much a total bust in the NFL. Rahim Abdullah was another highly-drafted player (2nd round by Cleveland in 1999) who played only two years in the league. His SPS was a poor -1.71. Cameron Wake was a significant outlier the other direction. He was undrafted, but should have been based on his athletic talent alone. His 1.28 SPS is top-20 all-time, and is by far the highest of any undrafted player at this position.
Jarvis Jones has significantly worse athletic measurables as a 3-4 OLB than Maybin or Abdullah with an SPS of -2.58. Interestingly, if we put Jones in the ILB universe he fares a lot better – he has only slightly below-average measurable attributes in that universe.
Below is the draft-adjusted SPS versus Annualized Career Approximate Value.
Adjusting Jones’ SPS for his lofty draft position gives him an adjusted SPS of -3.08, versus a universe average of -2.83 and a median of -2.68. This is lower than Aaron Maybin’s -2.09 and in-line with Abdullah’s -3.2. Jones will be outperforming his athletic ability if he has an annual average CaV of about 3, which is equivalent to Rob Ninkovich, Stewart Bradley (both 3.0s), and worse than Kroy Biermann (3.4). Jason Worilds, the man who Jones may have been drafted to replace, has an average CaV of 3.3.
For reference, below are the other players drafted in rounds 1-3 this year who fit the 3-4 OLB or smaller rush 4-3 DE “tweener” profile. Note that Damontre Moore doesn’t look great on this basis (or when benchmarked against the pure 4-3 DEs either.
As always, we note that using SPS or any other metric such as this is just one of many tools that pro and amateur NFL talent evaluators will avail themselves of. There are always exceptions to the rule, outliers, etc. and statistical analysis such as this is meant to be purely a guide and a reference to compare players with who has come before.


 © 2024 PFF - all rights reserved.