(“Today’s Crazy Fantasy Stat” is an occasional offseason offering from PFF that highlights something that catches our eye and aids in our preparation for the 2017 fantasy season.)
Quantity and quality. Ideally, of course, you want fantasy players who get a lot of attention from their teams and do a lot with that work, but then the first round of the draft ends and you have to look further.
So today, I’m going to look at 2016 quantity and quality one way. Of course, there are several ways of looking at it — yards, touchdowns, both, targets, routes run, receptions, etc. So my way below is far from the only way, but it’s what I’m going with today.
I noted three things: A player’s total number of opportunities (carries plus targets), fantasy points, and PPR fantasy points, and I noted the percentage of each of those out of his entire team’s slate of running backs, wide receivers, and tight ends. So Michael Thomas had 168 standard fantasy points, beating Todd Gurley’s 156, but Thomas’ 16.5 percent share of the New Orleans fantasy total was dwarfed by Gurley’s 27.3.
Obviously, that doesn’t mean Gurley offered nearly double the efficiency Thomas did. It means the offense surrounding Gurley was significantly worse than the one surrounding Thomas. One more step, then: the difference between a player’s percentage of team opportunities and his percentage of fantasy scoring. Gurley had 39.4 percent of the Rams’ total opportunities, but only 27.3 percent of the team’s standard fantasy points. Thomas, meanwhile, had 11.8 percent of the Saints’ opportunities, but 16.5 percent of the standard fantasy scoring. So, per my scale, Gurley had a -12.1, while Thomas had a +4.7. That better illustrated their respective efficiencies (especially as it compares to their teammates).
(One caveat before I continue: Starting running backs are always going to have more opportunities. David Johnson had 400 combined carries and targets, most in the league; Mike Evans led wide receivers, at 168, which was the 30th-most total opportunities in the league. So — Gurley vs. Thomas notwithstanding — I’m going to keep the comparisons going forward to intraposition conversations, to avoid apples-and-oranges comparisons.)
All the preparatory work out of the way, let’s look at some lessons learned from breaking things down this way:
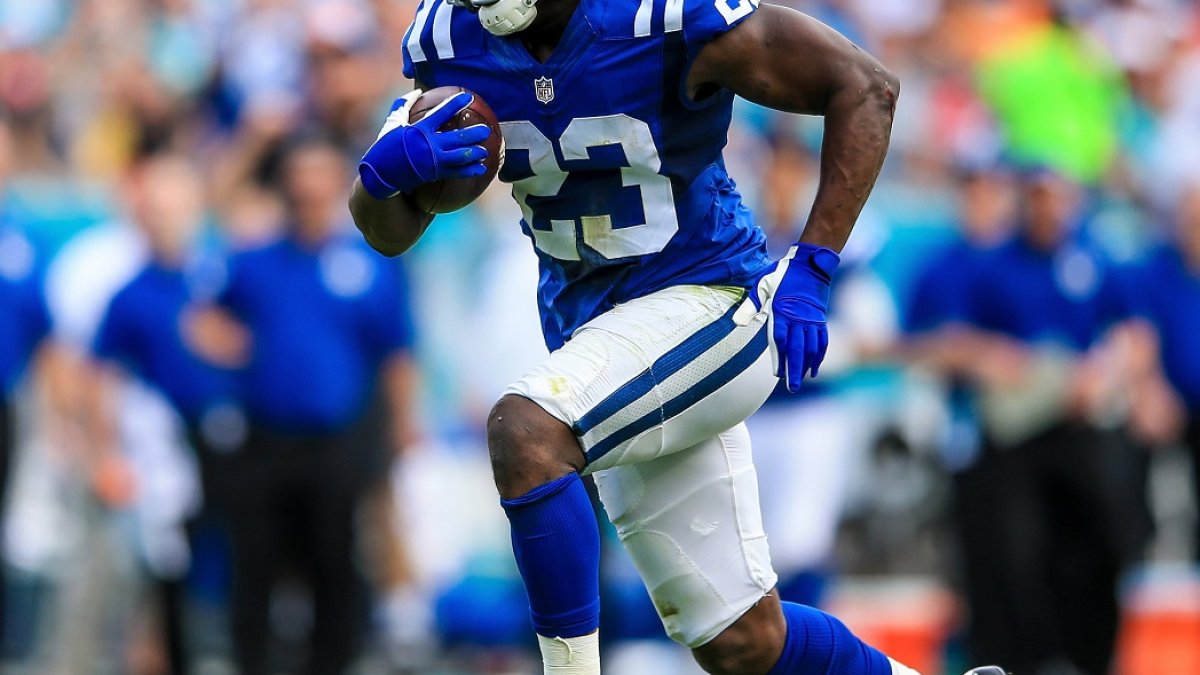
- Frank Gore finished 2016 with the worst overall numbers, with a -13.8 in standard fantasy scoring and a -17.2 in PPR. Gore had 35.1 percent of the Colts’ total chances in 2016 (263 carries and 44 targets), but only 21.3 percent of the team’s fantasy points (17.9 percent in PPR). That helps to explain why the Colts have been looking at running back options and drafted Marlon Mack in the fourth round. Gore is durable — he hasn’t missed a game since 2010 — and so will get plenty of quantity, but the quality hasn’t been there of late.
- The flip side of Gore is new Patriots running back Mike Gillislee. Gillislee had 13.7 percent of the Bills’ opportunities in 2016, but 15.3 percent of the team’s standard fantasy points, good for a +1.6. That might not sound like a huge number, but remember that running backs have such a huge market share of opportunities that it is that much harder for them to outproduce their opportunities. Gillislee ranked 100th among all RB/WR/TE options; the next-best running back with at least 50 carries was Ryan Mathews, who notched a +0.2 that ranked 210th. In other words, Gillislee was the only running back with 50-plus carries to finish in the top 200 flex options in efficiency. Gillislee and Mathews were the only running backs with 50-plus carries whose fraction of fantasy scoring outpaced their fraction of opportunities.
- Highlighting the RB/WR disparity, the top five RBs (still with a minimum of 50 carries) by standard fantasy scoring were:
- Mike Gillislee, Buffalo Bills (+1.6, 100th overall out of 503 total)
- Ryan Mathews, Philadelphia Eagles (+0.2, 210th)
- Shaun Draughn, San Francisco 49ers (-1.1, 408th)
- Darren Sproles, Philadelphia Eagles (-1.3, 418th)
- Tevin Coleman, Atlanta Falcons (-1.8, 428th)
- Of the big three running backs, David Johnson rated as the most efficient, at -4.2 in standard and -8.9 in PPR. Ezekiel Elliott was -5.5 (-12.6), and Le’Veon Bell was -9.2 (-11.5).
- Odell Beckham Jr. finished 2016 as the most efficient overall player by this metric, with a score of +9.8 in both standard and PPR. He had only 17.1 percent of the Giants’ opportunities, but 26.9 percent of the team’s fantasy scoring in either scoring system.
- Interestingly, the No. 2 in efficiency is a less big name — then-Rams wide receiver Kenny Britt, who had a +9.7 in standard and a +9.4 in PPR. Obviously, these numbers are subject to team, and a player, like Britt, who performed well amid a roster of disappointments, but Britt’s presence still stands out.
- The worst showing by a wide receiver in this measure per standard fantasy scoring was New England’s Julian Edelman, who had 17.0 percent of the Patriots’ opportunities but did worse in standard fantasy scoring, finishing with a WR-worst -2.5. (In Edelman's defense, the more efficient a player's teammates, the less efficient he could appear.) In PPR, Jermaine Kearse fared the worst, at -0.6.
- The player who met expectations the most (i.e., his rate of fantasy scoring was right in line with his opportunities) was Philadelphia's Dorial Green-Beckham, who got 7.1 percent of the Eagles' opportunities and 7.1 percent of the team's standard fantasy points.


 © 2024 PFF - all rights reserved.