(“Today’s Crazy Fantasy Stat” is an occasional offseason offering from PFF that highlights something that catches our eye and aids in our preparation for the 2017 fantasy season.)
Famously, the 2010 Chargers were, by yards and yards allowed, the No. 1 offense and defense in the league. They were only 10th-best in points allowed (and second in points scored) and finished the year 9-7, out of the playoffs.
Efficiency is the name of the game. You want yards, because they typically lead to points. You want points, because … well, come on. A team that gets a lot of yards without a correspondingly high point total is inefficient; a team that gets a lot of points without the yards you’d expect is primed for regression.
For the sake of visualization, here is every team over the last five years, charted by their yards per play against their points per play, with four circa-2016 dots highlighted (I’ll get to them in a bit):
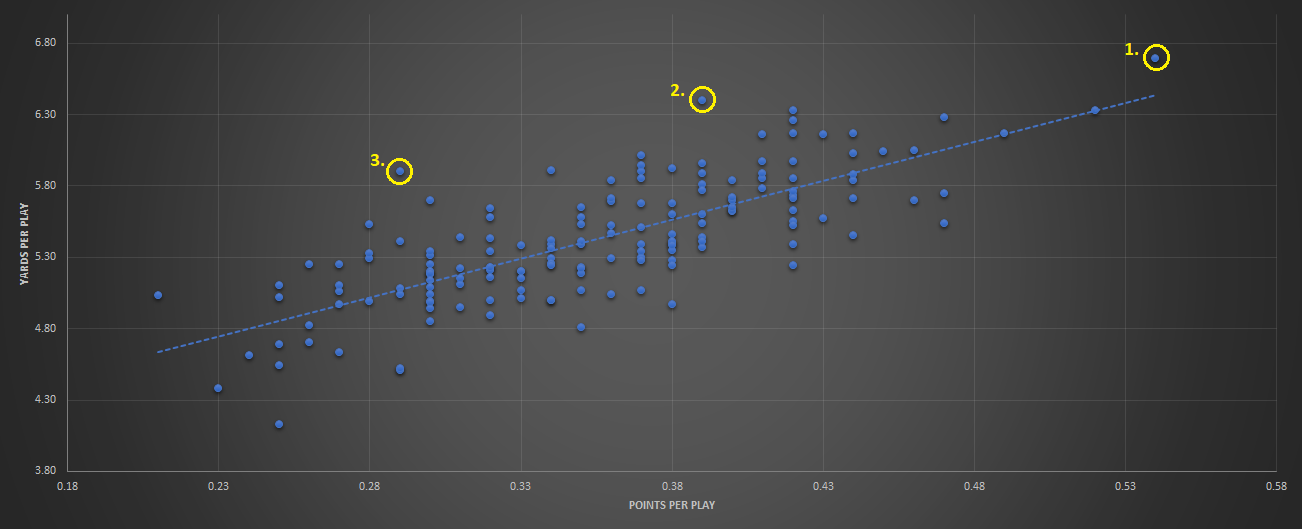
If you want to view this in the simplest possible terms, teams below the trendline put up more points than you’d expect based on their yardage, and teams above rack up high yardage but struggle to convert that to points. Again, in the simplest possible terms, the takeaway is that, if that’s year n, then you’d expect all of these teams to get closer to the trendline in year n+1.
So then, the teams who are the most above the line this past year would, you’d expect, get closer to the line in the year to come. That can be done one of two ways: Score more points, or gain fewer yards (or, obviously, a combination of the two). And it just so happens that three of the most notable outlier dots above the trendline came in 2016:
1. Atlanta Falcons
See that dot way the heck up there in the top right of the graph? That’s last year’s Falcons, who put up yards and points at a higher rate per play than any team in the last five years, and not by a little. Mathematically, though, the Falcons actually could have done slightly better. Still, let’s not get going on the criticism of a team that could scarcely have come closer to a Super Bowl title.
More touchdowns or fewer yards? This one is easy. Yes, the Falcons scored touchdowns at a slightly worse rate than you’d expect based on their yards, but even then, this is a team that set recent-vintage records last year. The Falcons will put up a lower yards-per-play number in 2017, almost by default. We’ve already pegged them as a regression candidate in 2017.

2. Washington
The Falcons put up the most yards per play of any team in the last five years (6.69), and more or less followed suit with 0.54 points per play, also the best. That makes some sense. Washington, meanwhile, had the second-most yards per play in the last five years (6.40), but tied for 42nd in points per play.
Washington produced two thousand-yard receivers last year in Pierre Garcon and DeSean Jackson. Those two combined for 7 touchdowns (3 for Garcon, 4 for Jackson). Julian Edelman and Greg Olsen were the only other two pass-catchers to reach 1,000 yards and fewer than four scores, and only six receivers had exactly four. Robert Kelley managed only seven scores himself.
More touchdowns or fewer yards? This one could go either way, but personally, I lean toward fewer yards. Jordan Reed aside, the team’s offensive options — Jamison Crowder, Josh Doctson, Terrelle Pryor, Kelley, Samaje Perine — are all varying degrees of unproven, while Kirk Cousins has his detractors as well. If everyone there reaches at or near his ceiling, the team could tally the yardage and improve the touchdown rate, but that’s asking a lot.
3. Chicago Bears
You’d be forgiven if you didn’t realize the 2016 Bears were top-25 in yards per play over the last five years (at 5.90, they were tied for 22nd). Part of that is because the Bears were 135th (out of 160) in points per play in the same span (0.29).
Jordan Howard, the Bears’ undisputed top offensive weapon last year, finishing with the second-most rushing yards and fourth-most yards from scrimmage among all running backs, yet he scored only 7 total touchdowns — only Lamar Miller had fewer among thousand-yard rushers. No one else on the Bears roster topped four touchdowns in 2016.
More touchdowns or fewer yards? Even with Mike Glennon or Mitchell Trubisky at quarterback in 2017, you’d have to assume the Bears would have more success at the position than they had in 2016. The Bears only have one theoretical star, in Howard, but at least some pieces should work out — development for Cameron Meredith, the addition of a pair of pass-catching backs in Benny Cunningham and Tarik Cohen, the arrival of Adam Shaheen and a host of second-tier receivers, and supposed health for Kevin White, etc. While the Bears won’t be setting offensive records in 2017, the team should get more efficient.
Other notes
A few others things that stuck out from this graph:
- Not that anyone needed convincing, but 2015 truly was the fluke year for the Jets offense — in the last five years, the Jets have four of the 15 worst points-per-play seasons, and 2015, when they were middle of the pack.
- The worst team in points per play in the last five years was the 2012 Chiefs, at 0.21. The worst in yards per play was the 2012 Cardinals, at 4.13. In both cases, the second-worst team was last year’s Rams (0.23 and 4.38, respectively). Based on the overall trendline, the Rams were actually a tiny bit lucky in their scoring prowess, if you can believe that.
- Remember that ridiculous Broncos offense from 2013? That team finished second in points per play (0.52) and third in yards per play (6.33), and still sits very clearly distant from that Falcons team from 2016. Only the denominators (the Falcons ran 995 plays last year; the Broncos ran 1,156 in 2013) keep them separate.

