It’s relatively easy to project how many plays a team will run in a particular game, and it’s relatively easy to project how a specific back or receiver will perform on average on his touches. But the critical piece of an excellent projection set is a realistic allocation of touches, and that is very difficult to forecast. Depth charts and player tendencies can provide the bases for workload projections with their own strengths and weaknesses, and both are effective for stable teams and position groups. However, the former really shine in situations where roles change because they avoid the big misses that characterize even short-term touch projections based on player tendencies.
To illustrate, I’ll hit on three examples from 2017 based on my best efforts to project early-down carry allocations with separate depth-chart and player-specific systems.
Scenario 1 – Depth chart remains the same
Example from 2017: Los Angeles Chargers
Melvin Gordon was the ultimate set-it-and-forget-it fantasy back in 2017. He played every week. He led the Chargers in early-down carries every week. And he took at least 60 percent of those early-down carries every week except for Week 10, when the team ran up such a big lead on the Bills thanks to Nathan Peterman’s five interceptions that Gordon’s backups could kill clock for him all second half.
That consistency created consistently good and consistently similar projections for Gordon’s workload by both my depth-chart and player-specific approaches. Only three times did the two projections differ by more than 10 percent of the team’s early-down carry allocation, and overall, the two methods were correct about as often as each other.
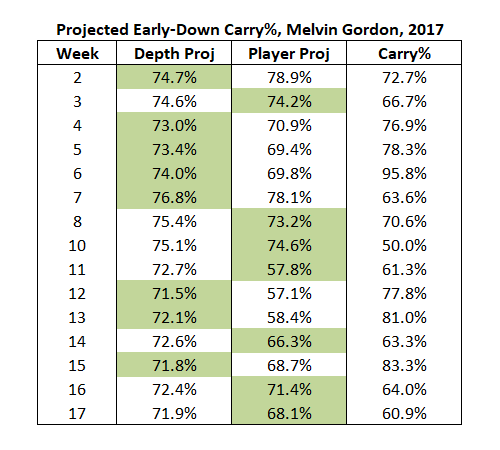
That result makes sense because, when a back has an extended hold of the No. 1 job in a backfield, his own tendencies and those of his depth in the team’s backfield become functionally equivalent. Put differently, it doesn’t really matter what approach you use to project the workload of a steady back like Gordon.
Scenario 2 – The lead back is out
Example from 2017: Dallas Cowboys
Things become more complicated when even a steady back misses time. Ezekiel Elliott provided about as simple an example of that as possible last season when he was suspended. It was clear that he was the team’s No. 1 early-down back before his suspension, and it was clear that he would become the team’s No. 1 early-down back when he returned. Both approaches to his projections fared fairly well, but those of his replacement Alfred Morris were another story.
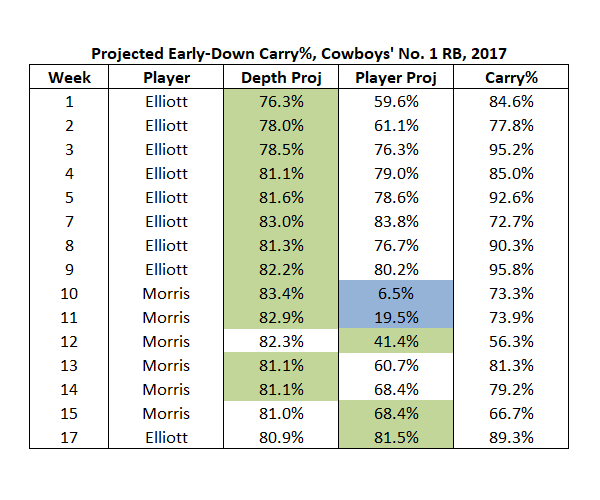
Since I’ve already restricted these scenarios to carries on first and second downs, Morris didn’t show a marked decline in his percentage of those carries from Elliott. Still, Morris did carry less of the workload, and so a projection based on the tendencies of the Cowboys’ No. 1 early-down back — which was built primarily on Elliott — routinely overestimated Morris’ volume.
But it turns out that overestimation was much smaller than the underestimation a player-based projection showed, in particular over the first few weeks of the lead back’s absence. When Morris drew the start in Week 10, he had barely touched the ball in recent weeks, and so his projected allocation based on his own tendencies came in way, way under at just 6.5 percent of the team’s early-down carries.
By four weeks into Morris’ stint as the team’s No. 1 back, his player-specific projections caught up to the truth of things. I designed the player-specific approach to rely on only a handful of the most recent games, which I found to be the optimal window to use for that type of projection. But even with that short window, damage is done. And, frequently, lead backs miss only a game or two when they suffer an injury, and so a player-specific approach will likely miss badly on its projection of his replacement’s carries for the duration of the lead back’s absence.
Scenario 3 – The lead back loses his job
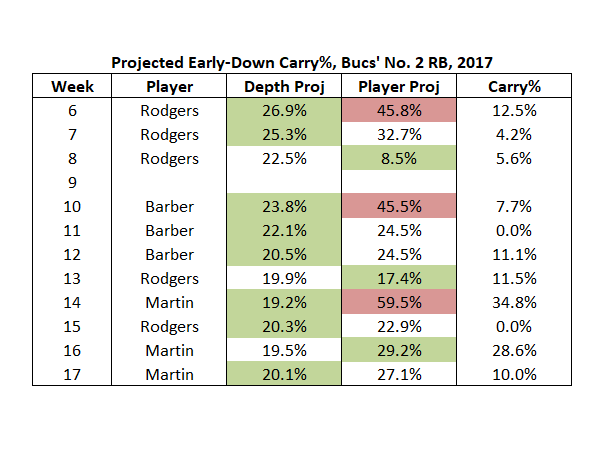
Example from 2017: Tampa Bay Buccaneers
The transition from one lead back to another is similarly rough for a player-based workload projection when that transition happens because of a benching. Doug Martin lost his starting job around Week 13 last season. Notice how Peyton Barber’s initial player-based projection pegs him at 8.5 percent of the team’s early-down carries. That’s the same bad miss that Morris showed on the Cowboys.
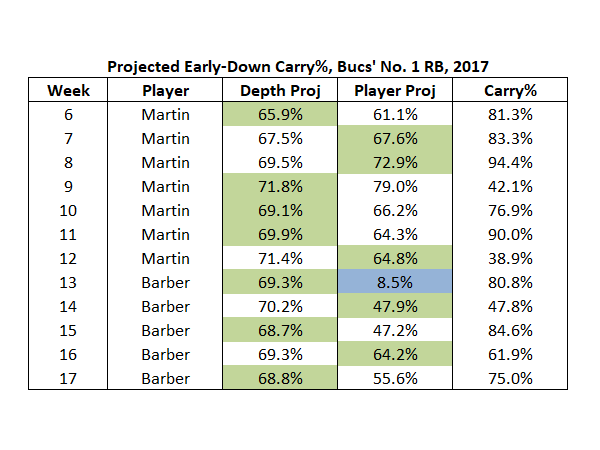
Meanwhile, a timeline of the Bucs’ second-string backs shows corresponding bad projections in the other direction. Jacquizz Rodgers’ player-based projection was way too high the week after Martin returned from his start-of-season suspension. Barber’s was way too high in Week 10 after a false role change the week before, and Martin’s was way too high when actually lost his job a few weeks later.
If the goal of a set of projections or rankings is to be as close to right as possible for as many players as possible, this research suggests that depth charts provide a better foundation for touch allocation than the players do themselves. By splitting up touches into groupings like early-down carries, third-down carries, and goal-line carries, detailed depth charts can do a lot of the heavy lifting you associate with player-specific tendencies while also remaining flexible to changes in jobs and injuries.

