Earlier this week, we took a look at last season’s most and least consistent fantasy players (by both production and usage). Sometimes that’s just due to luck or variance, but other times it’s due to the specific nature of a player’s role. For instance, wide receivers heavily reliant on deep targets for fantasy production are far more volatile than, say, a true possession wide receiver like Julian Edelman. In today’s article I wanted to focus on another oft-forgotten component to fantasy volatility — gamescript.
In each chart below, broken down by position, we’re looking at how often a player’s team was trailing or leading and each player’s fantasy splits in both categories. The difference between these numbers represents how much a player benefited from a specific gamescript (in this case, either leading or trailing). The more “gamescript-sensitive” players will be the ones on either end of the chart
By determining how gamescript-dependent a player was last season, we should be able to make some educated guesses about their role next season. If a team’s quarterback scored a high percentage of his fantasy points when trailing last season, and the inverse was true for the running back, we might surmise that the team “played it safe” when ahead in games. This might mean that if the team had a game against the Patriots (unlikely to be leading), that quarterback might be an interesting and underpriced DFS play that week. Today, we’ll be taking a look at every fantasy-relevant position but focusing mostly on quarterbacks and running backs.
Quarterback
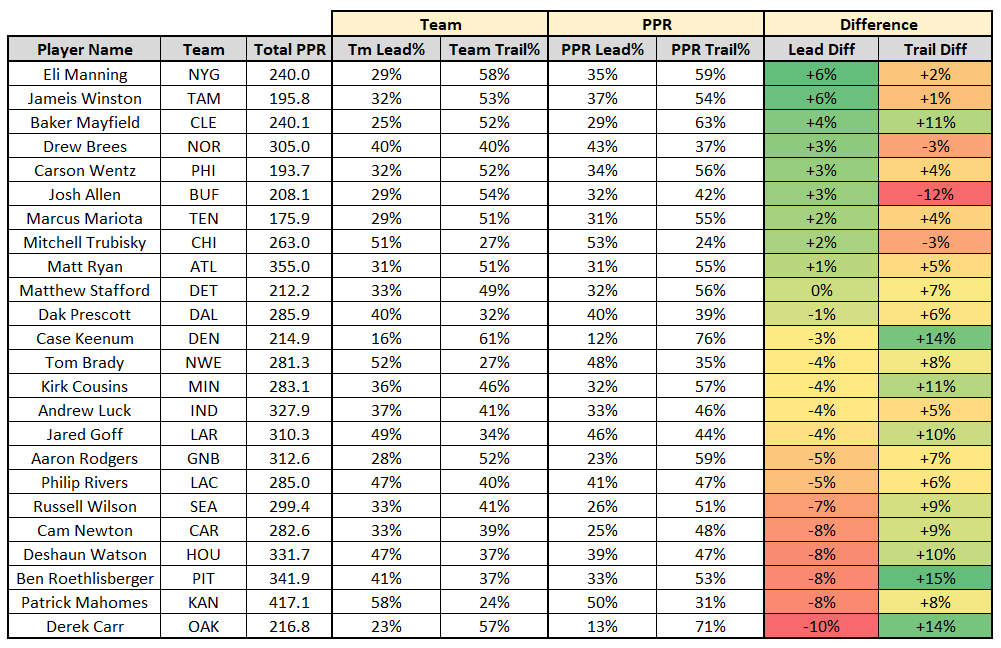
As evident in the chart above, quarterbacks are typically far more productive when trailing. This makes sense intuitively — when there’s more of an urgency to put points on the board, teams will run less and throw more. Last season, on average, teams passed 66.9% of the time when trailing, but only 49.6% of the time when leading.
Alex Smith was our most gamescript-dependent quarterback in both 2016 and 2017. This wasn’t a surprise at all, considering Smith has long held a reputation of being a game manager. What's surprising is, that though Patrick Mahomes just broke the record for most fantasy points scored by any quarterback in a single season, he too saw a massive decline in production when leading. Mahomes was already due for a massive regression, but if Kansas City’s defense improves considerably in 2019 (they ranked ninth-worst in points allowed last season), it might be an even steeper falloff than the one we had initially anticipated.
Derek Carr, Ben Roethlisberger, Deshaun Watson, Cam Newton, Russell Wilson, Case Keenum, Kirk Cousins, and Jared Goff all also had splits that implied they were used as game managers in 2018. However, this was only backed up by usage in the cases of Wilson, Keenum, Newton, Goff, and Watson, who all ranked bottom-12 in pass percentage when leading. Absurdly, Seattle ranked last in pass percentage when trailing and second-to-last in pass percentage when leading. Although Wilson has been one of the league’s most efficient quarterbacks for a number of seasons now (ranking top-three in fantasy points per dropback in six of seven seasons), this certainly puts a dent in his 2019 fantasy potential.
Meanwhile, Eli Manning, Jameis Winston, Josh Allen, and Drew Brees were all on the other end of that spectrum. Tampa Bay ranked third and New York ninth in pass percentage when leading, so these numbers make some sense, however, they may also be skewed by the incompleteness of our methodology. Teams are more likely to pass when leading if the score is close, or if they’re trailing by a wide margin, and both Tampa Bay and New York rarely held a sizeable lead. Remember, our methodology only looks at whether the team was trailing by leading and not by how much they were trailing or leading.
Running backs
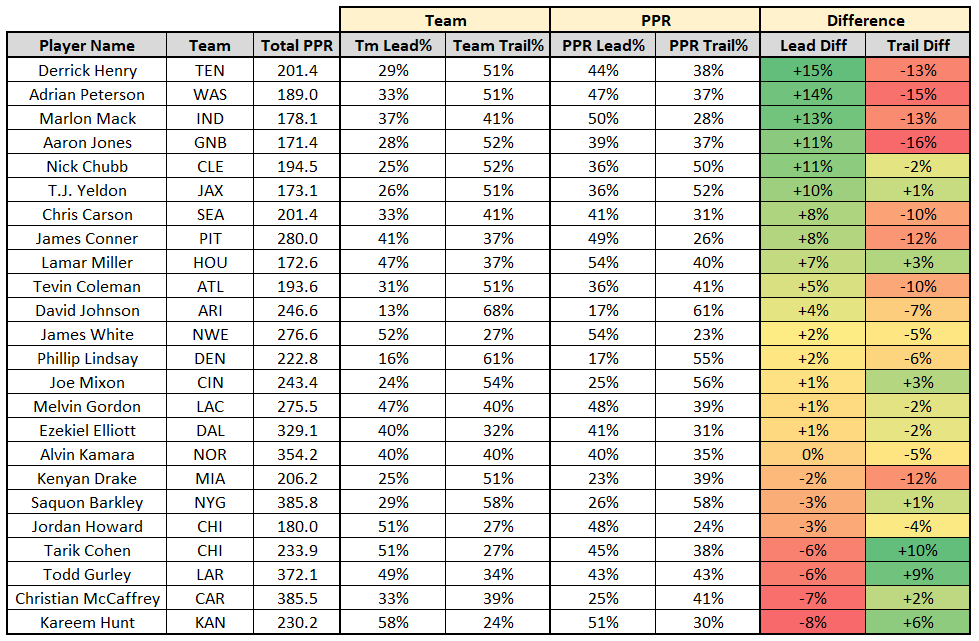
While all other positions benefited from negative gamescript, the opposite was true for the running back position. Remember, when teams are playing with a lead, they’re more likely to run the ball.
The running backs who most benefited from positive gamescript (and were the most hurt by negative gamescript) were Derrick Henry, Adrian Peterson, Marlon Mack, and Aaron Jones. All of these names made perfect sense in hindsight. None of these running backs led his backfield in targets, and when their team was trailing (teams run more frequently when leading) they were routinely pulled for a more capable pass-catching back. When the team was leading, they’d go run-heavy and let their early-down workhorse dominate touches (especially near the goal-line) and take time off the clock.
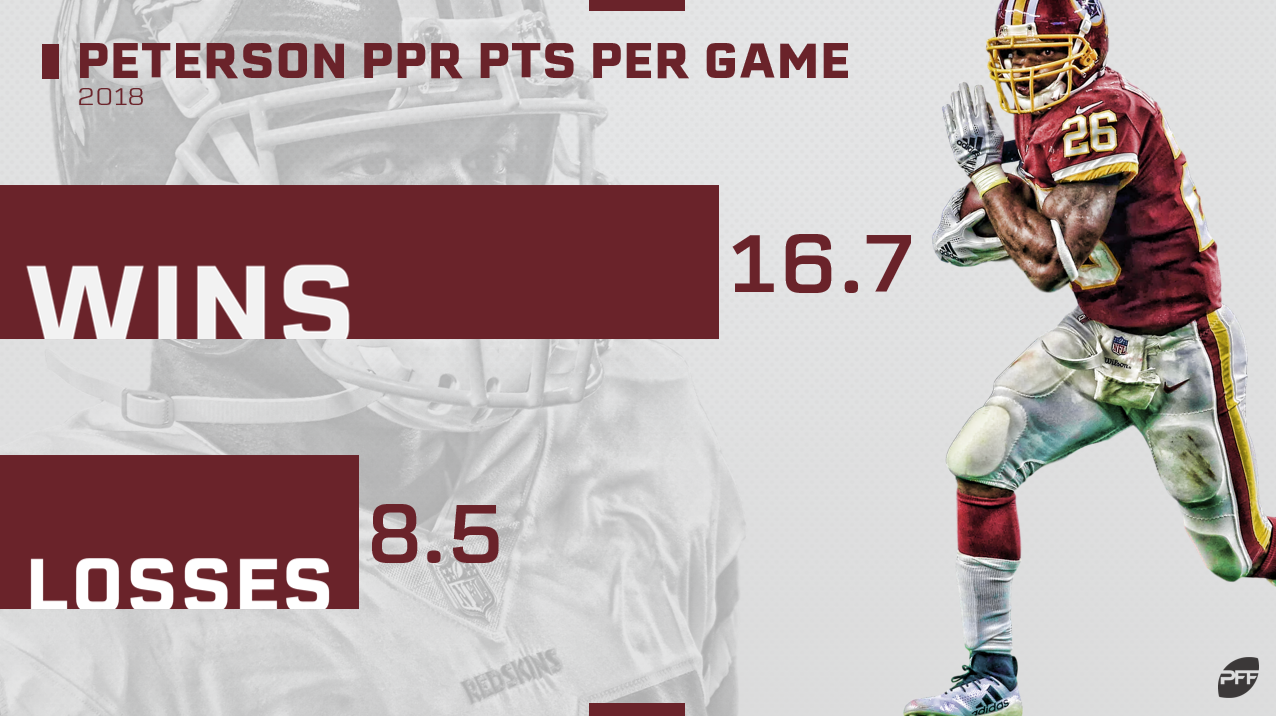
Peterson and Mack especially stood out for fantasy, mostly only being fantasy-viable in victories (typically blowout victories). Last season, Peterson averaged 16.7 fantasy points per game in victories but only 8.5 fantasy points per game in losses, while Mack scored 70% of his fantasy points in games Indianapolis won by 14 or more points.
James Conner also, surprisingly, ranked highly. Although, I argued earlier this offseason, we should be treating him almost exactly as we would Le'Veon Bell had he never left Pittsburgh, maybe that’s not entirely true. Conner did see a comparative workload to Bell, but he only averaged 5.5 targets per game last season, while Bell averaged 7.1 in 2017. While that’s not a major difference, and maybe that number climbs for Conner next season, it would make him more gamescript-dependent than Bell has been throughout his career.
On the opposite end of the spectrum, the following running backs benefited most from negative gamescript (and were most at a detriment under positive gamescript): Tarik Cohen, Todd Gurley, Kareem Hunt, Christian McCaffrey, and Saquon Barkley. Again, these running backs were their teams’ primary pass-catching backs. I think the important stat here is that, in PPR leagues, a target is worth 2.74 times as much as a carry for fantasy running backs. So, while Barkley should see a decrease in scoring opportunities next season, as New York’s offense is likely to decline without Odell Beckham Jr., he should more than make up for that loss with an increase in targets.
Although DFS players like to target running backs likely to win their games, and while that correlation is usually correct, it depends on the specific running back and their role. For instance, as the data here suggests, I’d be more inclined to play a pass-catching specialist in a game they’re likely to be trailing throughout.
Wide receivers
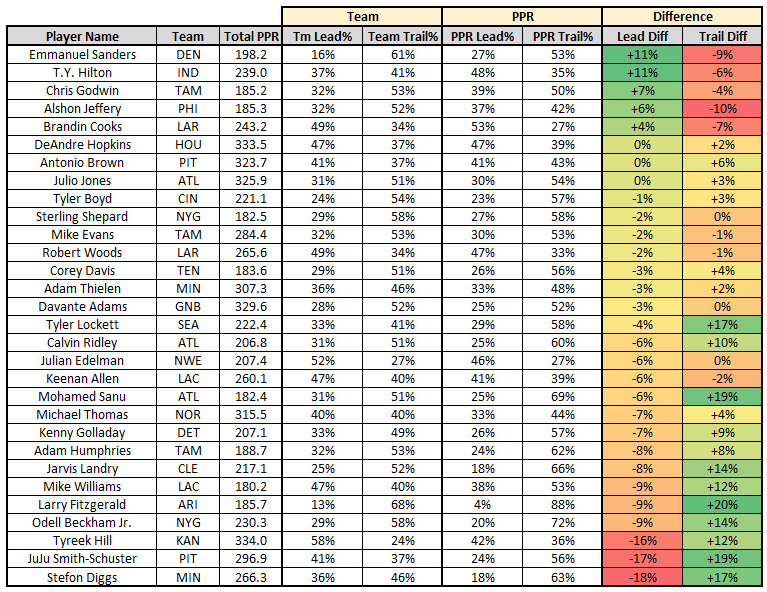
Like with quarterbacks, you’ll see all wide receivers benefited greatly when their team was trailing. This makes sense considering how heavily a wide receiver’s production is tied to their quarterback.
Overall, I don’t see much significance in these numbers, at least in terms of looking for a serious takeaway for 2019 drafts. However, I will say, for the most part, players who ranked highly in red zone target market share also ranked highly in differential when leading. The inverse was also mostly true, and that should make sense intuitively — teams outscoring their opponents are more likely to reach the end zone than teams already trailing, and touchdown potential will be higher for these types of receivers. Intuitively, it might also make sense that deep threats performed better when trailing, when there’s more of an urgency to put points on the board, and more of a demand for big plays. However, the data only somewhat bore this out.
Tight ends
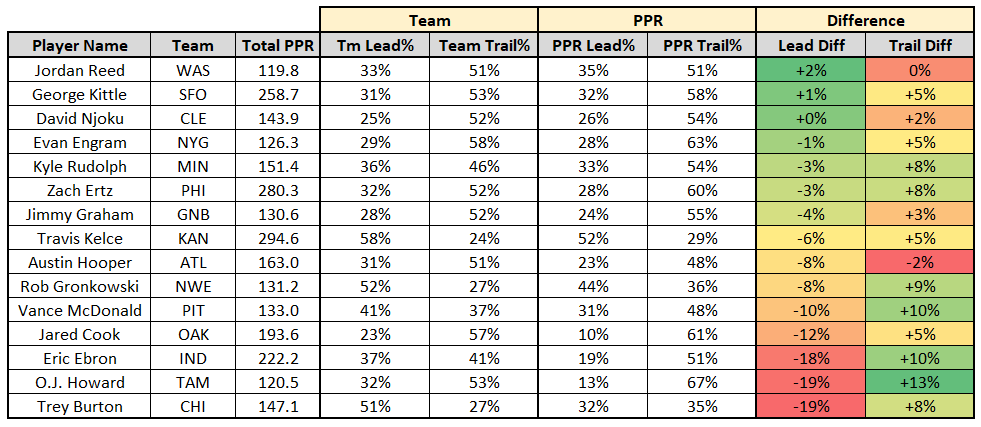
With tight ends, we see a similar trend to wide receivers — an increase in scoring when trailing. We also see, like with wide receivers, a number of these players posted similar splits to their quarterbacks. However, and again, like with wide receivers, I’m struggling to find any serious fantasy implications.

