With the data collected and organized, I wanted to start my weather research with the element I suspected would have the biggest impact on games: precipitation. It’s also likely the element that is most difficult to properly study. Whereas temperature tends to be similar over a radius like the 30 miles I required my selected weather stations to be from stadiums and makes few sudden, sharp changes, rain can be isolated. It can start and stop in games. It can be light or heavy and change between the two. And all of those subtle differences likely impact games in different ways.
To get a handle on things, I decided I first needed to confirm that the precipitation data I collected could be used to determine whether it rained during games. The test I designed to do that simplifies things a great deal. First, I limited precipitation readings to those that happened within 10 miles of a stadium, not the full 30 miles I collected. I hoped that would eliminate some false positives. Then, I averaged every hourly precipitation reading that was made from 1 hour prior to the start of a game to 4 hours after the start of a game. That left me with a single number — average precipitation depth in millimeters per hour — that I could use to represent each game’s precipitation intensity.
Following that approach, these are the 12 games I suspected had the heaviest rainfall since 2009. I included links to NFL highlight videos where I found them.
| Games with the Most Estimated Rainfall, 2009-17 | |||||
| Season | Week | Home Team | Stadium | Precip Depth (mm/hour) | Video |
| 2015 | 8 | CAR | Bank of America Stadium | 12.1 | Link |
| 2016 | 4 | TB | Raymond James Stadium | 7.9 | Link |
| 2011 | 3 | TB | Raymond James Stadium | 7.9 | Link |
| 2017 | 4 | TB | Raymond James Stadium | 7.5 | Link |
| 2014 | 2 | TB | Raymond James Stadium | 7.4 | Link |
| 2017 | 8 | NYJ | MetLife Stadium | 4.4 | Link |
| 2009 | 14 | NYG | Giants Stadium | 4.3 | |
| 2013 | 17 | NYG | MetLife Stadium | 3.8 | Link |
| 2011 | 1 | BLT | M&T Bank Stadium | 3.7 | |
| 2010 | 1 | JAX | EverBank Field | 3.5 | |
| 2013 | 16 | CAR | Bank of America Stadium | 3.5 | |
| 2013 | 11 | CHI | Soldier Field | 3.5 | Link |
In all, I found video for eight of the 12 games, and six of those eight videos clearly show rain. Two of them are from this season. The first was the Week 4 contest between the Buccaneers and Giants. That game started in a downpour, but things cleared up and the game became something of a shootout. You might remember it as the game where O.J. Howard caught his first career touchdown, which was a blown coverage for 58 yards down the left sideline. It did not appear to be raining at that point.
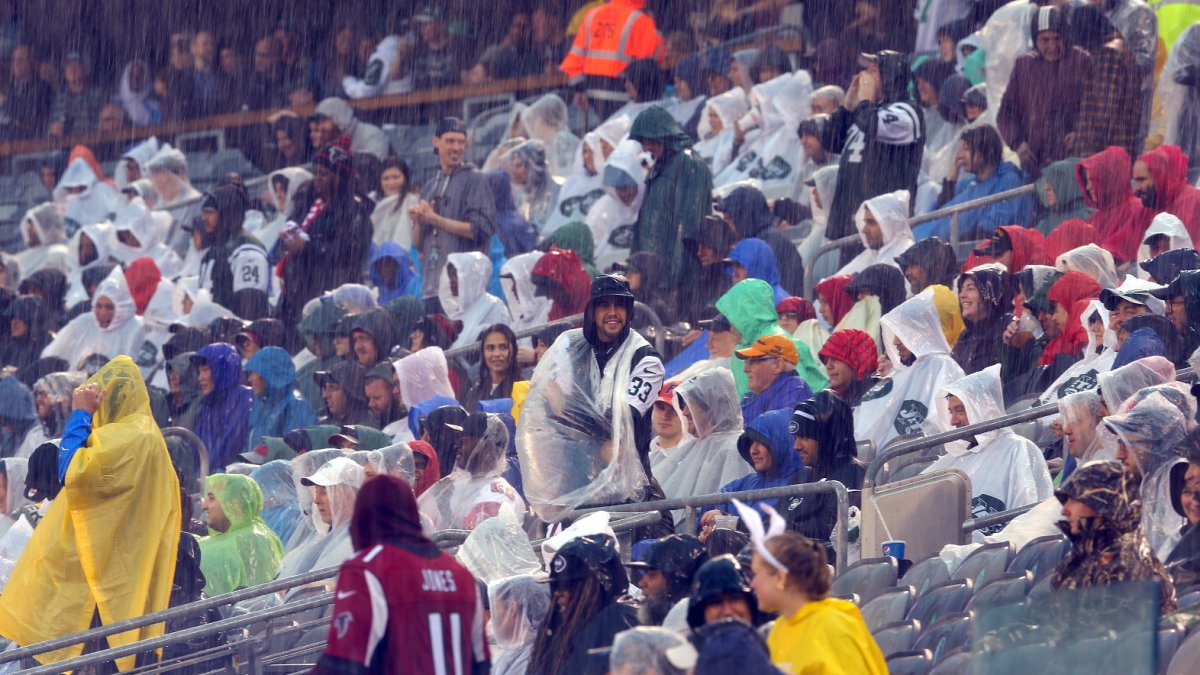
The second game from this season was in Week 8 between the Jets and Falcons. That rain was spotty, too. You can see it most clearly in the video around the 1:53 mark, and that will also remind you that this was the game where Matt Ryan fumbled multiple exchanges with his center.
The two games in my sample where I do not see any rain are the Week 17 game in 2013 in MetLife Stadium and the Week 3 game in 2011 in Raymond James Stadium. Among the games without video, I can confirm the Week 16 game in Carolina’s Bank of America Stadium did have rain. As a Panthers fan, I remember that game as the one where the Panthers clinched their first playoff berth since 2008 and their first with Cam Newton at quarterback. The rain in that game was also inconsistent.
I think the major takeaways of my investigation are that (1) I am successfully identifying games with rainfall but (2) I’m not correct in every case and (3) many games with rainfall do not have it consistently throughout. It’s not perfect, but I think it will work. What I expect it will do is cause me to underreport any impact of precipitation I find, and that is the correct side to err on, especially given that any future projections will be subject to the uncertainties of weather forecasting.
With an established approach, there are still a number of avenues of potential research. Ryan provided anecdotal evidence of increased fumble rates. I also suspect quarterbacks are less accurate and receivers drop more passes. But I’ll start from a coaching angle. I believe coaches believe what I just expressed, and that leads them to prioritize a more conservative offensive game plan that relies heavily on running the ball. And you can see that even with just a simple split of pass-run ratio by rain intensity.
| Rain Intensity's Impact on Team Pass% | ||
| Rain Intensity | Sample Games | Pass% |
| None | 1,171 | 56.0% |
| Light | 207 | 55.2% |
| Moderate | 22 | 52.7% |
For the purposes of this table, I’ve classified rainfall as light if it’s non-zero and less than 2.5 millimeters per hour and moderate if it’s at or above 2.5 millimeters per hour. I’ve also required games with no rainfall to still be outdoors.
The numbers suggest that coaches run more when it rains more, but note that there just aren’t very many games with moderate rainfall. That undermines the confidence I would otherwise feel given that the trend in this table matches my expectation. That’s especially true because we know that there are important other factors that influence a coach’s decision to run the ball, in particular the composition of his roster and the game script. I felt I needed to test both of those before I could draw a conclusion.
For the former, I ran weighted average comparisons that calculated the difference in pass percentages for individual team-seasons when there was rain — either light or moderate, which I calculated separately — and when there was no rain. Those results tell a similar story to the previous table. Teams pass a little bit less than they typically do when it lightly rains, and they pass significantly less than they typically do when there it rains more heavily.
| Weighted Average Changes in Team Pass% | ||
| Rain Intensity | Sample Plays | Change in Pass% |
| Light | 25,085 | -0.6% |
| Moderate | 2,722 | -4.7% |
For the latter, I thought game situations would be easiest to examine in chart-form. I’ve published a chart similar to this one before because I used it to help create my definitions of garbage and CG time, the subject of my Monday columns. Based on the understanding I’ve gained with that research, I’ve zoomed in here to look only at team pass percentage in what I consider to be normal time, where the offense’s win probability is between 16 and 92 percent. The green line represents pass percentage when there is no rain, and the gray line represents pass percentage when there is either light or moderate rain — I couldn’t split the two because there just aren’t enough plays with rain for each win probability bucket.
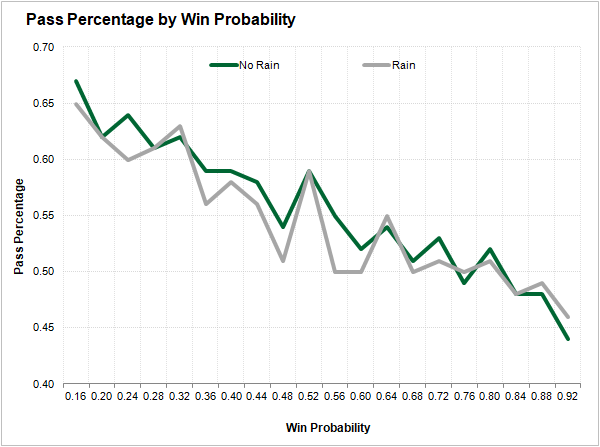
It isn’t perfectly smooth, but pass percentage tends to fall a few percentage points when it rains for every win probability compared to when it doesn’t rain. And that’s all I needed to see. All signs point to the fact that teams run the ball more frequently when it rains. I’ll need to examine factors like efficiency and fumble rates to know for sure, but these trends lead me to believe that quarterbacks and receivers should be downgraded and running backs upgraded when the forecast calls for precipitation.

