Last fall, I ran a series of articles on weather research that used station data from the National Oceanic and Atmospheric Administration to study changes in team and player performances under various weather conditions. That research covered a variety of phenomena from cold temperatures to heavy wind speeds and precipitation, most of which had noticeable impacts on production. Those findings should be helpful for projecting player statistics — in particular for DFS — pending a couple of steps. First, the research needs to be synthesized. Second, since the research was based on historical weather data, I need to find a way to systematically pull weather forecasts for future games.
I had the former need in mind when I wrote the articles, so pretty much everything you’ll see in the subsequent tables was published with the original research. However, if you’d like to go back and read through the details of it, here are the links.
Introduction: Link
Rain: Part 1 and Part 2
Wind: Part 1 and Part 2
Snow: Link
Temperatures: Link
The takeaways from those articles I think are best split into team-level and player-level. Here are the former.
| Weather's Impact on Teams | ||
| Phenomenon | Stat | Change |
| Light Rain | Pass% | -0.6% |
| Moderate Rain | Pass% | -4.7% |
| Snow | Pass% | -6.0% |
| Snow | Plays / Gm | -2.2 |
| Temp 30 – 49 | Pass% | -1.3% |
| Temp < 30 | Pass% | -2.2% |
And here are the latter.
| Weather's Impact on Players | |||
| Phenomenon | Pos | Stat | Change |
| Light Rain | QB | Comp% | -2.3% |
| Light Rain | QB | YPA | -0.32 |
| Light Rain | RB | YPC | +0.19 |
| Light Rain | RB | Fum / Carry | +0.003 |
| Light Rain | RB | Avd Tackles / Carry | +0.010 |
| Light Rain | RB/WR/TE | Catch% | -2.3% |
| Light Rain | RB/WR/TE | Drop% | +1.2% |
| Light Rain | RB/WR/TE | Yards / Tgt | -0.40 |
| Light Rain | RB/WR/TE | YAC / Tgt | -0.18 |
| Moderate Rain | QB | Comp% | -3.4% |
| Moderate Rain | QB | YPA | -0.33 |
| Moderate Rain | RB | YPC | +0.04 |
| Moderate Rain | RB | Fum / Carry | +0.015 |
| Moderate Rain | RB | Avd Tackles / Carry | +0.016 |
| Moderate Rain | RB/WR/TE | Catch% | -2.4% |
| Moderate Rain | RB/WR/TE | Drop% | +1.0% |
| Moderate Rain | RB/WR/TE | Yards / Tgt | +0.03 |
| Moderate Rain | RB/WR/TE | YAC / Tgt | +0.02 |
| Snow | QB | Comp% | -4.1% |
| Snow | QB | YPA | -0.07 |
| Snow | QB | TD / Att | -0.006 |
| Snow | QB | INT / Att | +0.002 |
| Snow | RB | YPC | +0.089 |
| Snow | RB | TD / Carry | +0.023 |
| Temp 30 – 49 | QB | Comp% | -1.8% |
| Temp 30 – 49 | QB | YPA | -0.17 |
| Temp 30 – 49 | QB | TD / Att | +0.000 |
| Temp 30 – 49 | QB | INT / Att | +0.002 |
| Temp 30 – 49 | RB | YPC | +0.07 |
| Temp 30 – 49 | RB | TD / Carry | +0.000 |
| Temp < 30 | QB | Comp% | -3.1% |
| Temp < 30 | QB | YPA | -0.19 |
| Temp < 30 | QB | TD / Att | +0.001 |
| Temp < 30 | QB | INT / Att | +0.001 |
| Temp < 30 | RB | YPC | +0.26 |
| Temp < 30 | RB | TD / Carry | +0.005 |
| Wind 5-10 mph | QB | Comp% | -0.7% |
| Wind 5-10 mph | QB | YPA | -0.13 |
| Wind 10+ mph | QB | Comp% | -1.8% |
| Wind 10+ mph | QB | YPA | -0.30 |
Across the board, those changes can be applied as multipliers for player projections if you know the weather forecasts for game locations and times. To find those, I did a bit more research and found an excellent API from an organization called Open Weather Map. Many of their services are designed for big businesses and farms and priced accordingly, but their free tier has weather forecasts that include temperatures, wind directions and speed, and precipitation estimates every three hours for the next five days. That’s about the perfect window for a weekly football projection.
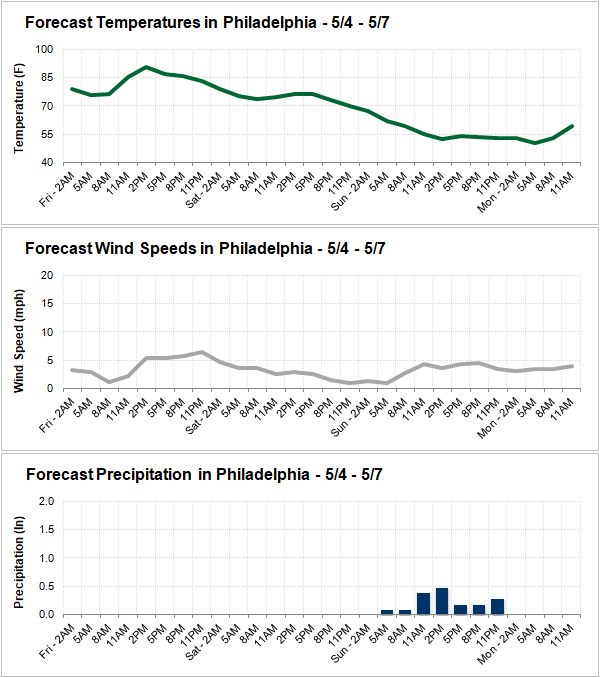
After snagging an API key and writing a bit of code, I can now pull weather forecasts for the locations of upcoming games, which I already had databased via stadium latitude and longitude coordinates. As a demonstration, here are a few charts of the forecasted weather in Philadelphia this past weekend (taken in the middle of last week).

Even with a cold front coming in on Sunday, the temperatures and wind speeds would likely be too mild to make a noticeable impact on a hypothetical game there. However, the forecast did call for some light rain midday on Sunday, so if the game was then, I could apply the light rain multipliers to reduce projected team pass percentage, quarterback completion percentage, quarterback yards per attempt, etc. Of course, the real season doesn’t kick off until four months to the day from Sunday, and I won’t be able to showcase the full importance of this information until the week before then.


 © 2024 PFF - all rights reserved.