There are many ways to slice and dice football stats through the lens of fantasy, but ultimately, what we’re looking revolves around opportunity and talent. Measuring success on a fantasy-point-per-touch or per-target basis is a great way to identify the players who are talented enough to make the most of their opportunities.
We did a study on fantasy points per touch this offseason, and no we’re bringing it to you — on a weekly basis — in the regular season.
We’re going to run through the leading running backs on a fantasy-points-per-touch basis, wide receivers and tight ends on a fantasy-points-per-target basis, and we’ll cap it off by showing you which teams give up the most points per opportunity (e.g. which matchups you should be targeting).
Running backs
|
Top RBs in Fantasy Points Per Touch |
|||
| Player | Touches | FP | FP/T |
| Alvin Kamara | 17 | 41.1 | 2.42 |
| Austin Ekeler | 10 | 23.6 | 2.36 |
| Chris Thompson | 11 | 24.8 | 2.25 |
| Isaiah Crowell | 10 | 22.2 | 2.22 |
| David Johnson | 14 | 17.5 | 1.25 |
| Jay Ajayi | 15 | 18.2 | 1.21 |
| Jalen Richard | 14 | 16.9 | 1.21 |
| Joe Mixon | 22 | 25.9 | 1.18 |
| Tevin Coleman | 10 | 11.5 | 1.15 |
| Chris Carson | 10 | 10.9 | 1.09 |
| Phillip Lindsay | 17 | 18.2 | 1.07 |
| Melvin Gordon |
24 | 25.6 | 1.07 |
| Dion Lewis | 21 | 22 | 1.05 |
| Saquon Barkley | 20 | 20.8 | 1.04 |
| James Conner | 35 | 36.1 | 1.03 |
| Todd Gurley | 23 | 23.7 | 1.03 |
| Nyheim Hines | 12 | 12.2 | 1.02 |
| Marshawn Lynch | 13 | 12.9 | 0.99 |
| Ezekiel Elliott | 18 | 17.6 | 0.98 |
| Christian McCaffrey | 16 | 15.5 | 0.97 |
(Min. 10 touches)
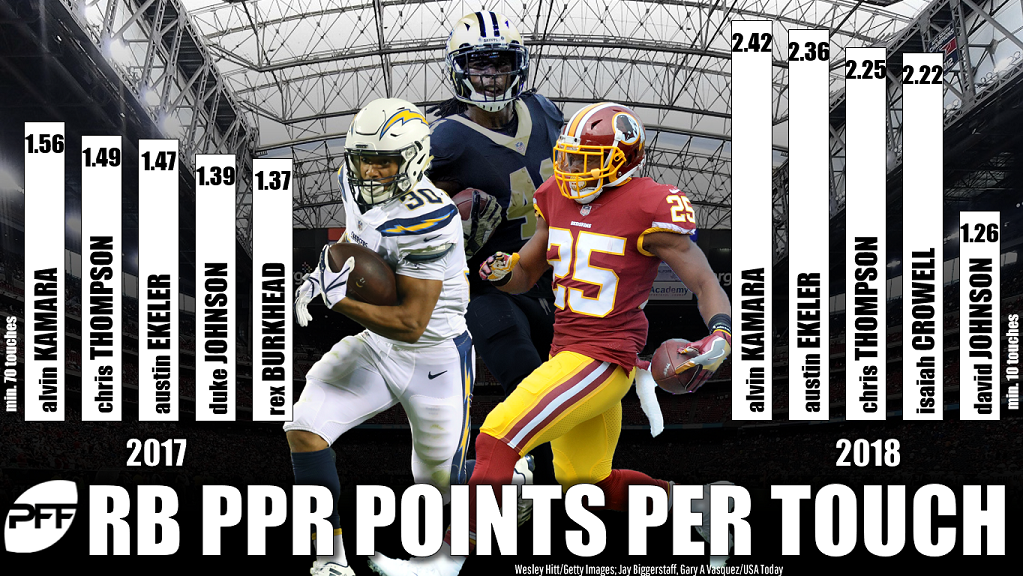
Last year’s top three running backs in terms of FP/T: Alvin Kamara, Chris Thompson, and Austin Ekeler.
This season’s top three running back in terms of FP/T: Kamara, Ekeler, Thompson. Same players, slightly different order.
Yes, it has only been one week, but that simple fact should highlight that this data point has some stickiness, and therefore, some usefulness.
David Johnson only touched the ball 14 times — an embarrassing misuse by the coaching staff — but he still ranked in the top-five in FP/T, which is a great sign for his value moving forward (not that there should’ve been any questions about it).
Joe Mixon ranked in the top 10 with 1.18 FP/T, and based on his usage, he’s going to be a true bell cow this season, as noted by Scott Barrett in Week 1’s stats to know piece.
Wide receivers
|
Top WRs in Fantasy Points Per Target |
|||
| Player | Targets | FP | PPT |
| DeSean Jackson | 5 | 31.6 | 6.32 |
| Kenny Stills | 5 | 26.6 | 5.32 |
| Tyler Lockett | 3 | 14.9 | 4.97 |
| Tyreek Hill | 8 | 35.9 | 4.49 |
| John Brown | 3 | 13.4 | 4.47 |
| Mike Evans | 7 | 27.7 | 3.96 |
| Chris Godwin | 4 | 13.1 | 3.28 |
| Ted Ginn Jr. | 6 | 17.8 | 2.97 |
| Randall Cobb | 10 | 29.2 | 2.92 |
| Josh Gordon | 3 | 8.7 | 2.90 |
| Davante Adams | 7 | 19.8 | 2.83 |
| Dante Pettis | 5 | 14.1 | 2.82 |
| Keelan Cole | 3 | 8.4 | 2.80 |
| Phillip Dorsett | 7 | 19.6 | 2.80 |
| Emmanuel Sanders | 11 | 29.5 | 2.68 |
| Stefon Diggs | 5 | 13.3 | 2.66 |
| A.J. Green | 8 | 21.2 | 2.65 |
| Terrelle Pryor | 3 | 7.9 | 2.63 |
| Geronimo Allison | 7 | 17.9 | 2.56 |
| Willie Snead |
6 | 14.9 | 2.48 |
(Min. 3 targets)
The PPT data here is going to be pretty skewed because of small sample sizes and long touchdowns messing everything up — but that doesn’t make the data meaningless. Tyreek Hill has always been a per-target beast, and that’s the case once again in 2018.
Chris Godwin, a second-year player, out-snapped DeSean Jackson 46 to 20 and built on his strong preseason, scoring 3.28 PPT on his four targets. He’s definitely a player to monitor this season.
Josh Gordon is going to smash once he starts to see more targets. He was only targeted three times — and caught just one of them — but that reception was an impressive touchdown, and it reminded us of what Gordon is capable of. The Browns will (should) get him more involved moving forward.
Phillip Dorsett scored 2.80 PPT on seven targets in Week 1. Dorsett’s seven targets were more than all other New England receivers combined. (Rob Gronkowski and James White each had eight.) There are only so many viable targets in New England, and Dorsett is making his case to be one of the regulars.
Tight ends
|
Top TEs in Fantasy Points Per Target |
|||
| Player | Targets | FP | PPT |
| Will Dissly | 5 | 19.5 | 3.90 |
| Rob Gronkowski | 8 | 25.3 | 3.16 |
| Eric Ebron | 5 | 15.1 | 3.02 |
| Jordan Reed | 5 | 14.8 | 2.96 |
| Tyler Eifert | 3 | 7.4 | 2.47 |
| Jared Cook | 12 | 27 | 2.25 |
| Benjamin Watson | 4 | 8.4 | 2.10 |
| Maxx Williams | 3 | 6.2 | 2.07 |
| Neal Sterling | 3 | 5.7 | 1.90 |
| Jesse James | 5 | 9 | 1.80 |
| Jake Butt | 3 | 4.9 | 1.63 |
| Geoff Swaim | 3 | 4.8 | 1.60 |
| George Kittle | 9 | 14 | 1.56 |
| Mark Andrews | 4 | 6.1 | 1.53 |
| Jack Doyle | 9 | 13 | 1.44 |
| Nick Boyle | 5 | 7 | 1.40 |
| Austin Seferian-Jenkins | 4 | 5.5 | 1.38 |
| Austin Hooper | 4 | 5.4 | 1.35 |
| Derek Carrier | 3 | 4 | 1.33 |
| Delanie Walker | 7 | 9.2 | 1.31 |
(Min. 3 targets)
Will Dissly came out of nowhere with a line of 3-105-1 on five targets last week. However, he ran a healthy 20 routes, which was not expected. If that continues, he could provide value, but for now, you can leave him on the waiver wire.
Gronkowski sitting near the top of the list is no surprise. What would be a surprise is if he doesn’t end up at No. 1 by season’s end. Gronkowski has a tough Week 2 game against the Jaguars, but he’s matchup-proof.
Eric Ebron saw high-value targets in the preseason, and that carried over into Week 1 as Ebron caught an end-zone target for a touchdown. Ebron was out-targeted back Jack Doyle 9-to-5, but if he continues to see red-zone/end-zone targets, he’ll be a viable weekly shot thanks to his touchdown upside.
Tyler Eifert played just 23 snaps, but he ran 16 pass routes and caught all three targets thrown his way for 44 yards. He’ll be hard to trust with such a limited snap count, but if his playing time increases, he’s going to emerge as a weekly starter — which will be badly needed this year, because the tight end position is thinning fast. Until then, he’ll be a touchdown-dependent streamer.
The best matchups
Below is a list showing how each team fares on a per-touch or per-target basis. This list will be updated weekly and can be used to identify strong matchups.
|
Fantasy Points Per Touch (FP/T) and Points Per Target (PPT) Given Up |
|||
| Team | RB: FP/T given up | WR: PPT given up | TE: PPT given up |
| ARZ | 1.27 (30) | 1.32 (6) | 2.78 (29) |
| ATL | 0.97 (20) | 0.95 (3) | 0.86 (8) |
| BLT | 0.38 (1) | 0.67 (1) | 1.44 (16) |
| BUF | 1.12 (27) | 2.66 (28) | 1.61 (19) |
| CAR | 0.95 (19) | 1.56 (17) | 1.20 (14) |
| CHI | 0.50 (5) | 2.79 (29) | 1.02 (10) |
| CIN | 0.72 (10) | 1.61 (20) | 2.03 (25) |
| CLV | 1.03 (24) | 1.48 (11) | 1.80 (20) |
| DAL | 0.83 (14) | 1.49 (12) | 1.93 (23) |
| DEN | 0.91 (18) | 2.16 (24) | 3.09 (31) |
| DET | 1.09 (26) | 2.87 (30) | 1.85 (21) |
| GB | 0.81 (12) | 1.40 (9) | 0.68 (3) |
| HST | 0.84 (15) | 1.79 (22) | 3.16 (32) |
| IND | 1.16 (28) | 2.44 (27) | 2.14 (27) |
| JAX | 0.98 (21) | 1.52 (14) | 1.07 (12) |
| KC | 1.45 (31) | 1.77 (21) | 1.93 (23) |
| LAC | 0.47 (4) | 3.37 (31) | 0.40 (2) |
| LAR | 1.02 (22) | 1.33 (7) | 2.07 (26) |
| MIA | 0.82 (13) | 0.88 (2) | 1.43 (15) |
| MIN | 0.41 (3) | 1.39 (8) | 1.56 (18) |
| NE | 0.88 (17) | 1.40 (10) | 0.85 (7) |
| NO | 0.38 (2) | 3.55 (32) | 1.85 (21) |
| NYG | 0.84 (16) | 1.49 (13) | 0.92 (9) |
| NYJ | 0.71 (9) | 1.57 (18) | 0.80 (4) |
| OAK | 1.08 (25) | 1.53 (15) | 0.00 (1) |
| PHI | 1.03 (23) | 1.26 (5) | 1.08 (13) |
| PIT | 0.60 (7) | 1.56 (16) | 0.81 (5) |
| SEA | 0.80 (11) | 2.01 (23) | 1.48 (17) |
| SF | 0.60 (8) | 1.59 (19) | 2.90 (30) |
| TB | 2.00 (32) | 2.38 (26) | 2.18 (28) |
| TEN | 0.59 (6) | 2.29 (25) | 1.05 (11) |
| WAS | 1.25 (29) | 1.14 (4) | 0.82 (6) |

