(Metrics that Matter is a regular offseason feature that examines some aspect of fantasy through a microscope to dive into the finer details.)
Last season, based on FantasyFootballCalculator.com’s ADP, Julio Jones was routinely being taken with the No. 4 overall pick in your fantasy drafts. Early this offseason, his ADP has fallen a full round, with Jones typically being selected with the No. 17 overall pick in drafts. For perspective, this is the lowest we’ve seen Jones’ ADP (i.e., the cheapest he’s been) since 2013.
Based on the ADP drop, you’d think Jones was coming off of a disastrous fantasy season. Instead, the all-time leader in receiving yards per game (95.3), finished as a top-seven fantasy wide receiver for the fourth consecutive season. He was still great, but granted, from a fantasy-point-per-game perspective, it was a step back for Jones. He averaged 15.7 fantasy points per game (10th-best at the position), which was 5.0 fantasy points per game less than his prior four-year trailing average.
So, why has Jones’ ADP dropped so precipitously? What caused the decline in production? Is Jones declining? And what does this mean for his current ADP?
Did Jones play poorly last season? Well, he graded out as our third-best wide receiver, so probably not. To dig even deeper, I wanted to test Jones’ 2017 season by our best metric to measure wide receiver efficiency – yards per route run. Well, in 2017, Jones averaged 3.08 yards per route run, which is the fourth-best number by any wide receiver this past decade. Jones actually now holds three of our top-five seasons and has led the league in yards per route run in four of his last five seasons. Clearly, this information suggests Jones is not on the downslope of his career.
So, if efficiency wasn’t the issue, maybe it was volume. Well, last season, Jones was targeted on 30.5 percent of his routes, which led the league and was the second-highest total of Jones’ career. By targets per game, his volume looks less impressive, but 2017 was still an improvement on 2016, implying volume was not the major issue.
All right, well, if it wasn’t efficiency or volume, maybe it was consistency. This critique holds a bit more merit and may have played a role in his ADP decline. His fantasy-point-per-game average over the past two seasons drops from 17.1 to 14.8 if we exclude his two highest-scoring fantasy games over this stretch. This 2.3-point decline is almost a full point more than if we put DeAndre Hopkins and Antonio Brown through the same exercise. Though, to be fair, Jones does own the best fantasy game by a wide receiver in each of the past two seasons, so he might be a bit unfairly impacted here. Maybe he’s a little bit less consistent, but he can single-handedly win some weeks for you.
I’ve buried the lead for long enough. What was the reason for Jones’ slightly down year? Well, I’d say “variance” or “bad luck,” but you might say “poor touchdown efficiency.” Basically, Jones just didn’t score a lot of touchdowns. Last season he became the first player to total at least 1,300 receiving yards (he had 1,444) and to score fewer than four receiving touchdowns. Last season, Jones ranked top-10 among wide receivers in targets inside the 5-yard line (four), targets inside the 10-yard line (10), red-zone targets (18), and end-zone targets (16), and still, only scored three touchdowns.
Although the data suggest he wasn’t efficient in this department, I’m not going to be too hard on Jones here. Fantasy football places an extremely high premium on touchdowns (one receiving touchdown is worth 60 receiving yards), but they’re rare events with a small-sample and low predictiveness year-over-year. So when I see Jones’ high volume/production/efficiency numbers everywhere else, I’ll overlook the low touchdown total, instead eagerly awaiting the positive touchdown regression that’s likely to come (and at a now-reduced price-tag).
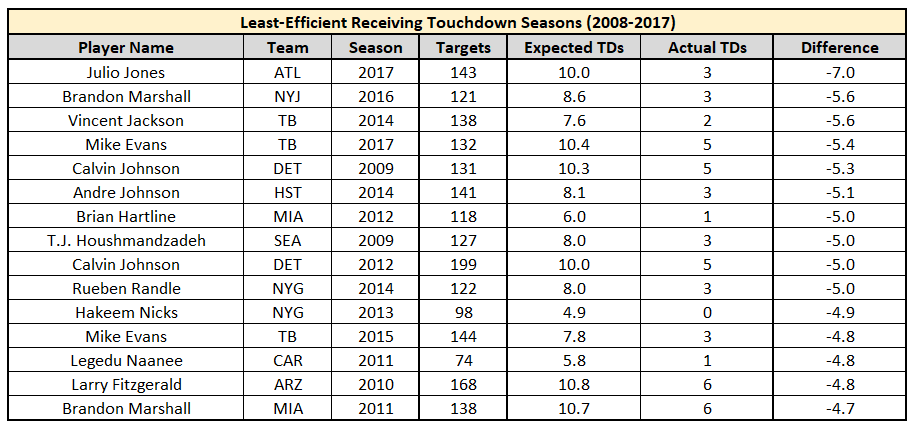
To illustrate just how “unlucky” or “inefficient” Jones was in the touchdown department last season, I tried to reproduce something similar to Mike Clay’s OTD metric to calculate a player’s expected touchdown total. This metric, by my methodology, looks at the historic touchdown rates of all targets on a 10-year sample by depth of target and distance from the end zone, to calculate a player’s expected touchdown total in any given season. For perspective, impressively, expected touchdowns beats out actual touchdowns in correlation to touchdowns in the following season.
Over the past decade, Jones’ 2017 season was the single-least-efficient touchdown season by any wide receiver. Looking at all of his targets, the data suggests he should have scored seven more touchdowns (worth an additional 2.6 fantasy points per game) than the three he ended the season with.
Although his 2017 numbers look terrible in this department, he was actually very efficient at scoring touchdowns in all other years of his career. Prior to 2017, Jones totaled 34.2 expected touchdowns but scored 40. For 2018 fantasy drafts, I’m chasing the positive touchdown regression and am pouncing on Jones at his current ADP.

