
PFF Fantasy is entering its eighth NFL season, and we are as committed as ever in our mission to bring the best data, content, and tools to passionate football fans. This year, we’ve streamlined our subscription packages to include two tiers: PFF Edge ($39.99) and PFF Elite ($199.99).
But what are PFF Edge and PFF Elite, and how can you get the most out of your subscription?
This article will guide you through everything we have to offer. I’ll be your “tour guide” (so to speak), and I’ve been with PFF Fantasy since Day 1, so I like to think I know what PFF has to offer. But I still seem to learn something new every week, and I’m hoping to pass some of that knowledge off to you.
This isn’t hyperbole: This year, we are offering you the most robust package of data, content, and tools yet. You will have access to the same data that we base much of our own research off of; the DFS articles are more easily accessible; much of our data is now downloadable for you to complete your own research; our back-end tools for player research have never been better — and the list could go on.
Here’s what we have to offer.
All premium articles — including DFS (Edge & Elite)
This year, we will bring you over 30 articles per week. Assuming each article is 1,000 words of fantasy goodness, that’s over half a million words for you to peruse between now and the end of the season. So, yeah, you won’t be lacking content.
And new this year, our DFS articles we be accessible to everyone with a subscription (both Elite and Edge).
Weekly content includes:
- WR-CB Chart
- Snaps, Pace & Stats
- Bell-cow report
- Actual Opportunity report
- Trade Value Chart
- DFS tournament plays
- DraftKings & FanDuel cheat sheets
- Points Per Opportunity breakouts
- Sit/start advice
- Weekly matchup previews
- D/ST and QB streamers
- IDP waiver wire; IDP sits/starts
- Dynasty stock watch
- Much more
Find the articles that speak to you and read them on a regular basis. Our articles are published on set schedules, so you can know when to expect your favorite content.
And an added bonus: The content has never looked better on mobile devices. Give it a look.
PFF Player Grades and Snap Counts (Edge & Elite)
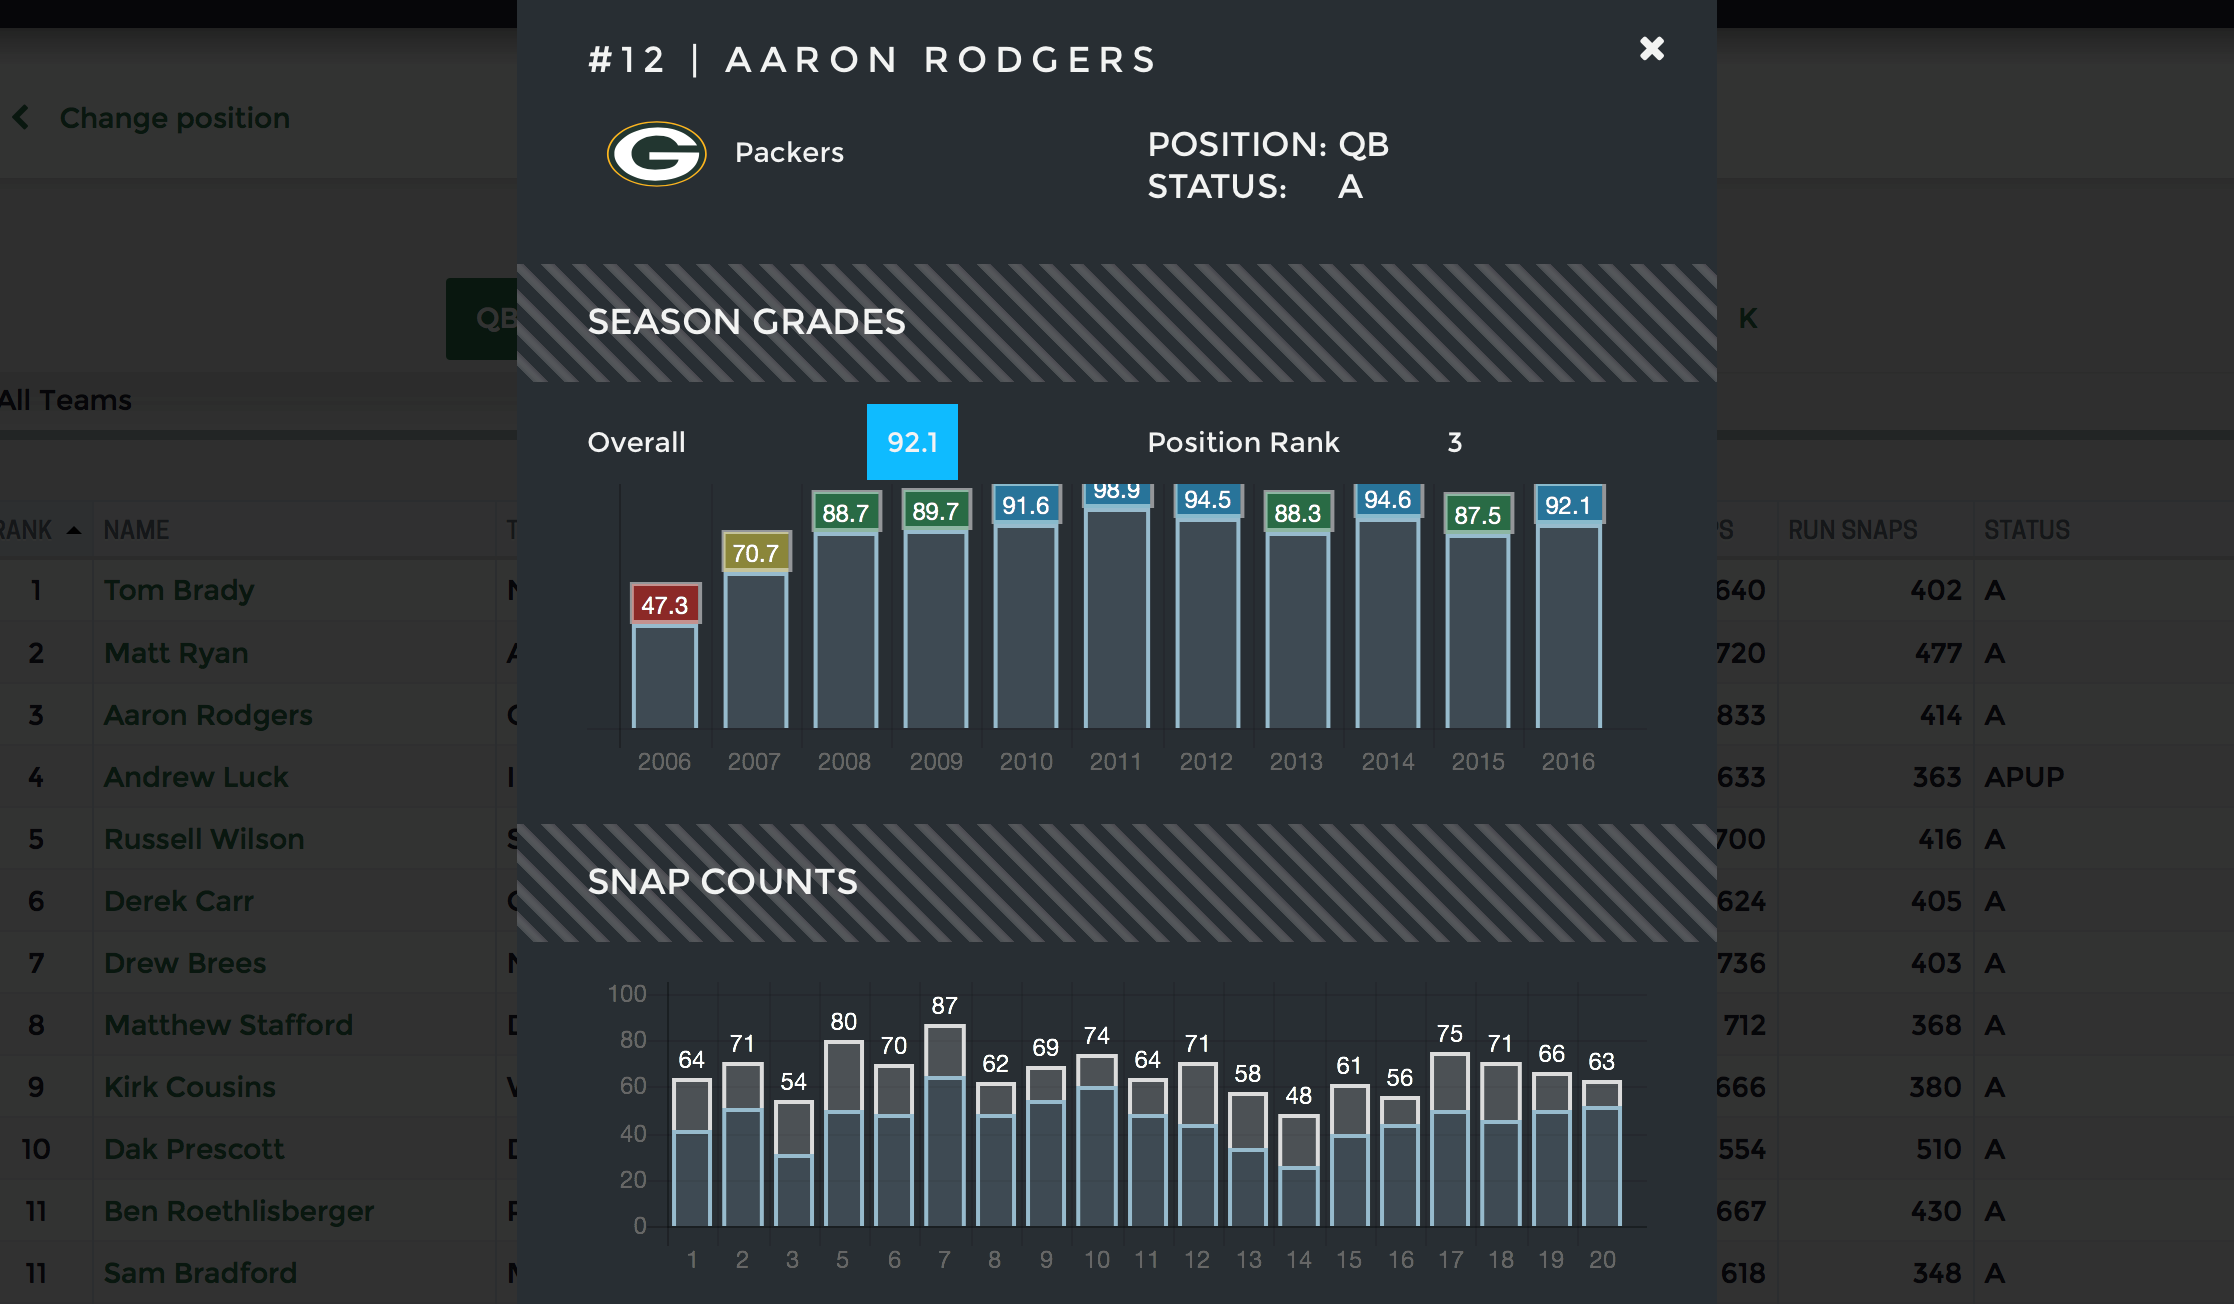
This is PFF’s bread and butter, and it’s easy to see why. PFF’s grades enable you to discover how any player across any position is performing. Track your fantasy players or your favorite team — it doesn’t matter to us.
How a player performs in real life does not always matter when it comes to their fantasy value. Blake Bortles was a top-five fantasy quarterback just a few years ago, after all. But that’s not to say these tools aren’t useful for fantasy purposes. Using the grades, you can discover players that might be in line for more snaps because of great real-life play. Then using some of our other tools — like fantasy points per snaps or points per opportunity — you can see which players might shine in fantasy if given more opportunity. You’ll be the first to know when those stars start to align.
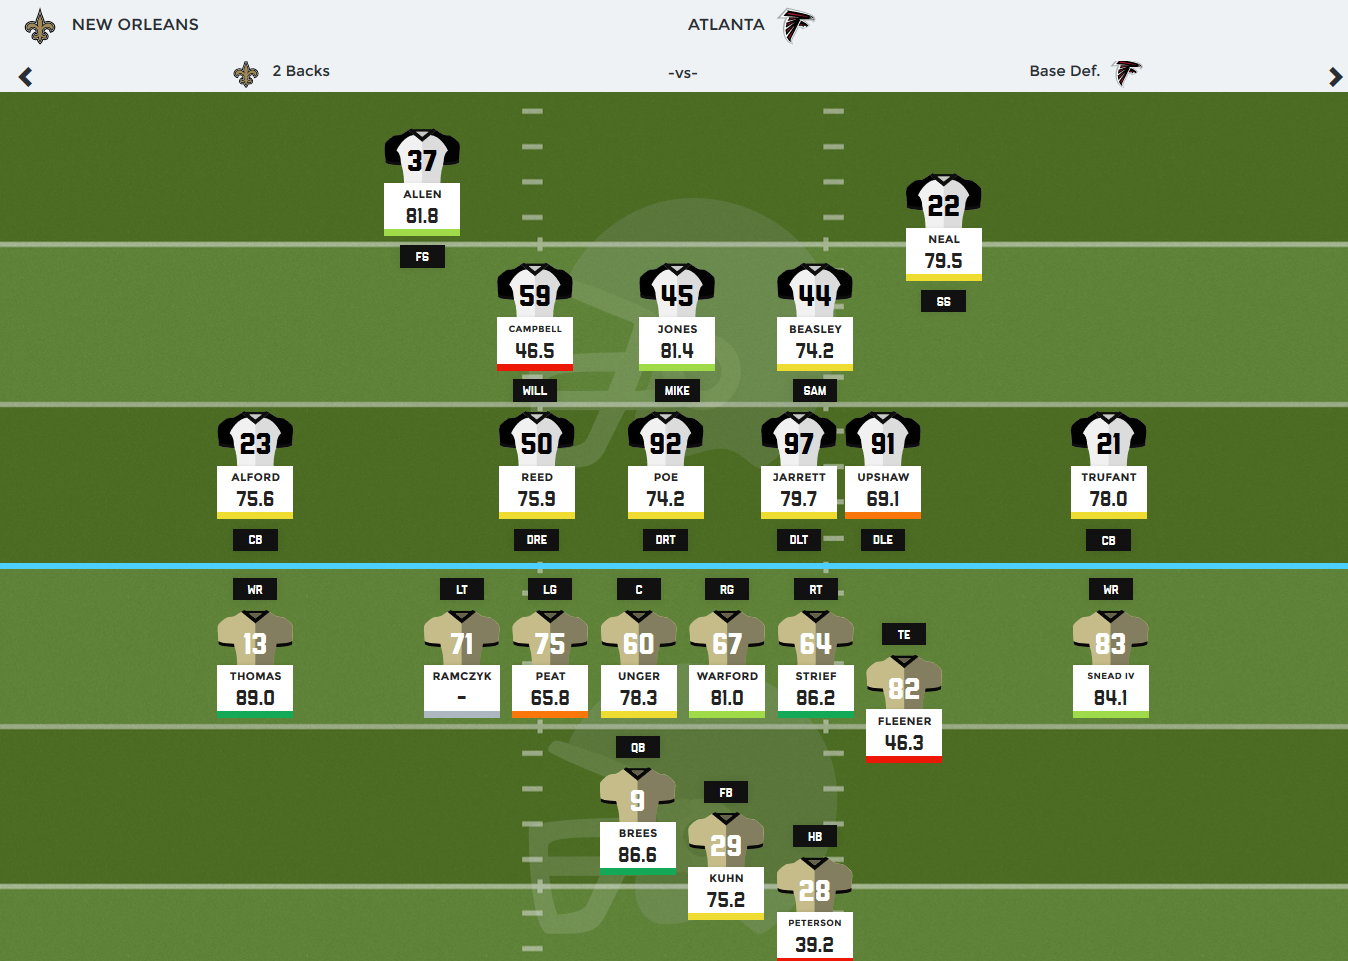
The tool also shows you the team vs. team matchups for any given contest, and displays each player’s grade on the matchup screen. If you’re deciding between two running backs for your RB2 slot in a particular week, you might want to check out this tool to see which one has a better matchup. Will their offensive line be outmatched? This tool helps you easily find the answer.
You can also use the tool to track player snap counts. If you’re deciding between a few different players on the waiver wire, check out their recent snap trends. Opportunity is everything in fantasy, and the snap count data lets you see who is getting the most of it.
Fantasy player profiles (Edge & Elite)
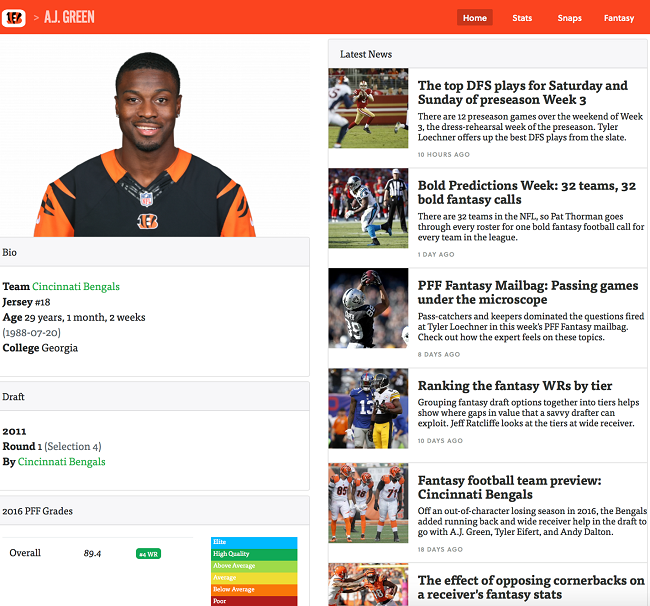
Our player profile pages let you easily track everyone on your team — and everyone on your watch list.
Do not underestimate this page. Our content team takes great care in tagging players when they appear in articles, which means it takes no effort on your part to find the latest news on your target player.
If we wrote about your player in the WR-CB matchup column, you’ll know. If he was highlighted in the Trade Value Chart, you’ll know. If he’s primed for a big week because of a PPO mismatch, you’ll know.
The “stats” tab lets you see legacy data on any particular player. One of the coolest features — at least for wideouts — is the TD40+ column. I can see that A.J. Green has scored at least two touchdowns of 40-plus yards each year he’s been in the league. DeSean Jackson has at least three such scores in four straight years.
Weekly rankings (Edge & Elite)
There’s no reason to be bashful about this: PFF Fantasy is home to some of the most accurate rankers in the industry.
PFF well-represented in the top-30:@JeffRatcliffe – 7th@DanClasgens – 12th@Pat_Thorman – 22nd@LoechnerNFL – 30th
???????????? https://t.co/Mta0An8Ynq
— PFF Fantasy Football (@PFF_Fantasy) July 22, 2017
Our crew keeps rankings regularly updated so you don’t have to wonder if you’re looking at outdated material. We hold ourselves accountable to this, too, and you can see the last date each ranker updated their rankings.
Our weekly in-season rankings will help answer most of your sit/start questions. And we don’t just rank standard leagues and call it a day. We want to make sure all corners of the fantasy industry are covered, so our rankings include:
- Standard
- PPR
- .5 PPR
- IDP
- Dynasty
- Dynasty with IDP
- Rookie-only
- Rookie IDP
- Developmental players
- College Football
Getting the most out of rankings is pretty straightforward. If you want to know who to start between two players in a given week, check our rankings.
Here’s an important thing to remember: We have a handful of rankers at PFF Fantasy, so be sure to check out each writers’ individual thoughts. The rankings are also aggregated into a consensus staff ranking, but it’s really useful to see more than one set of rankings. If every writer on the staff has one player ranked higher than another, your answer should be easy.
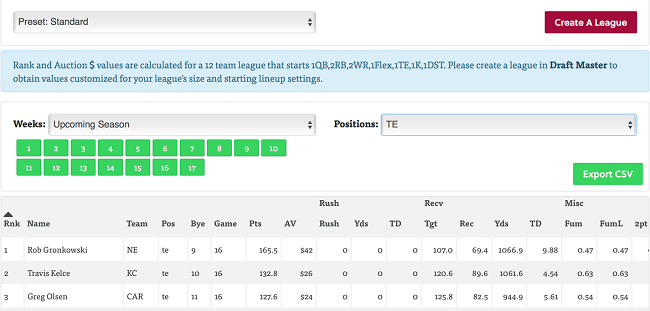
Draft Master & Season GM (Edge & Elite)
Our Draft Master & Season GM tools let you fully customize your PFF experience. Set up your league to receive league-specific rankings, projections, and more.
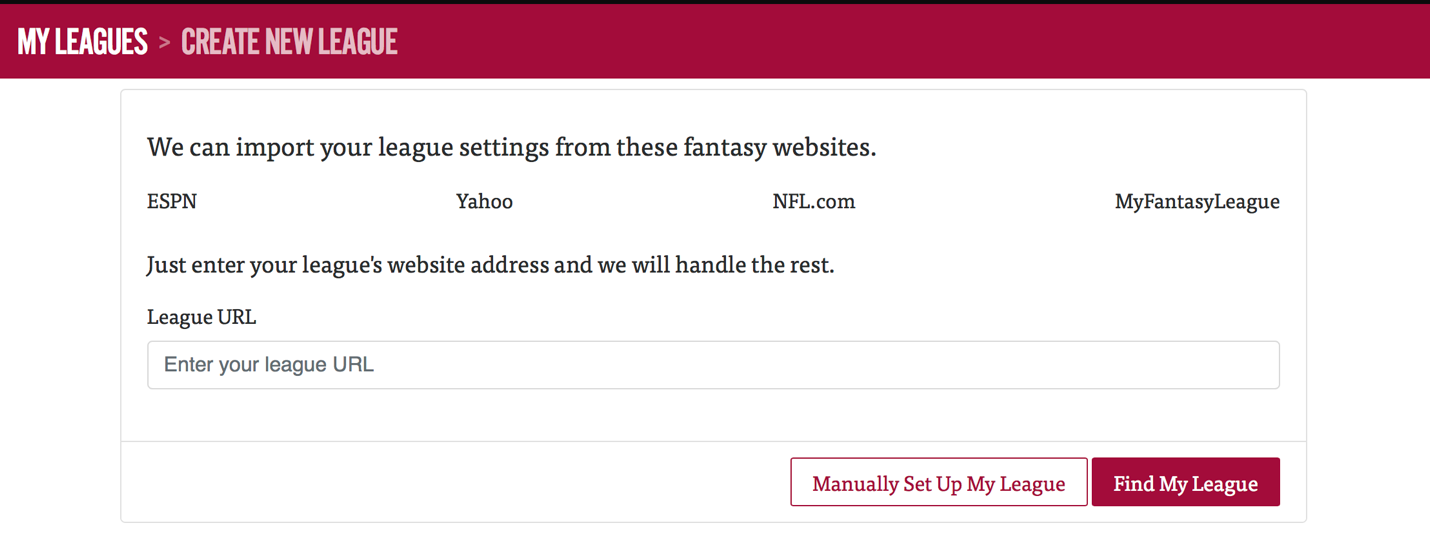
If you play on ESPN.com, Yahoo.com, NFL.com, or MyFantasyLeague.com, all you have to do is copy/paste your league’s URL and click “Find My League.” Our system automatically uploads your league settings for you.
If you don’t play on one of those sites — don’t sweat it. It’s incredibly easy to set up a league manually. Set up scoring type, draft type, keepers vs. no keepers, and specific scoring rules. Our system handles the rest.
Once your league is set up, you’ll be brought to a portal page with several options, including player rankings and projections, customized to your league’s specific settings. The portal also offers positional cheat sheets, players to target by round (tier lists), and auction values, all of which are meant to help you win your draft.
You can also run a run mock draft — or 173 mock drafts, if you’re like me — to try out every strategy under the sun. The mock drafts take just minutes to complete.
I cannot recommend using this tool enough to test out different approaches to your draft. What happens if you start RB-RB-RB? What if you don’t take an RB until Round 7? What if you flip everything on its head and take two TEs in the first four rounds? Just use the mock draft tool.
If you aren’t 100 percent prepared for your draft, we still have your back. You can bring PFF Fantasy into the draft with you and get our advice in real-time — literally. Just select the players as they get chosen in your league, and PFF’s Draft Master tool will help with suggestions along the way.
Projections (Edge & Elite)
This has always been a personal favorite, and I have no doubt you’ll find it useful, too. We’re the data guys, so you better believe that our data-driven projections are based on facts, not opinion.
Choose from one of our preset modes (standard, PPR, IDP, etc.) — or have the projections be based on your unique league settings. This is a fantastic way to discover players who are flying under the radar on draft day, or players who are a bit too cheap in DFS in a given week vs. their projections.
One of the best use cases for projections is to compare between positions. Deciding between a running back and a wide receiver for your flex spot? Cross-positional rankings can be a bit tricky, but projections are a little more cut-and-dry. See which one of the two players is projected to score more points that week.
You can view projections for just one specific game, or you can look at rest-of-season projections. It’s a good way to see who might could out on top in a trade, or which waiver wire target to choose when deciding between a few.
Legacy stats for the past 10 seasons (Edge & Elite)
Bask in the glory of statistics. In his magical 2007 campaign, Tom Brady scored 0.66 fantasy points per dropback. Michael Vick and Aaron Rodgers both had 0.69 PPDB in 2011, but Cam Newton outdid everyone in 2015, with 0.73 PPDB. It took me all of 20 seconds to find this data with our fantasy stats tab.
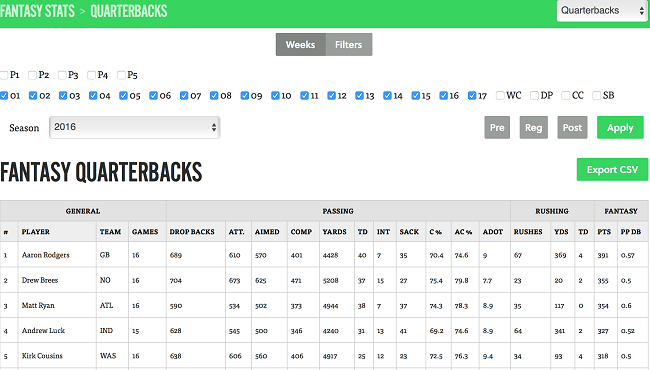
Filter by season — dating all the way back to 2007 — and by week, including the playoffs and preseason games.
This tool can help you find players who have been on hot streaks recently. For example, the above image shows that Aaron Rodgers scored the most fantasy points among all quarterbacks last season. But if we just look at the final four weeks of the (fantasy) season, we see the Andrew Luck was the top quarterback.
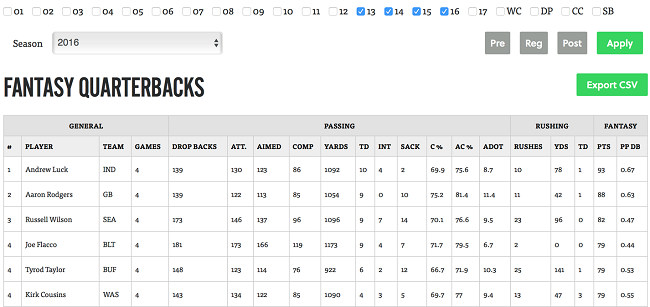
You can use these filters to your advantage. Want to see which Denver Broncos wideout has seen more targets over the past month? That’s easy. What about which New England Patriots running back has been given the most carries? Also easy.
The fantasy stats tab is the go-to for every one of PFF Fantasy’s writers, and it’s available to you through PFF Edge and Elite. In addition to your typical targets, attempts, yardage, touchdowns, and completion rate data points, some PFF-specific data points include:
- QB Points Per Dropback
- RB, WR, and TE Points Per Snap
- RB, WR, and TE Points Per Opportunity
- Average Depth of Target
- Tackles Avoided per Attempt
- Tackles Per Opportunity
- Targeted against rate
- And more
And that’s not even the best part. This is the best part:
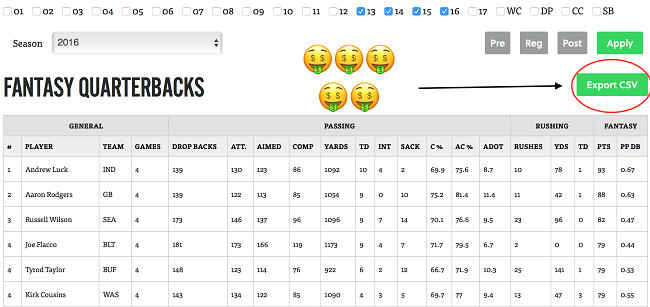
That’s right. New this year, you can export our premium fantasy stats data and explore it on your own. Set up pivot tables with Microsoft Excel and get lost in the data.
The PFF Fantasy staff works hard to help you win a championship, but there’s only so much we can do. It’s ultimately up to you to make the decisions and build a winning team. We wanted to make sure you were capable of making the best data-driven decisions possible, and we wanted to make it even easier for you to access our data in your own way.
Have fun.
2016 & 2017 Signature Stats (Elite)
We’re giving you access to our Signature Stats, which takes our data analysis to a whole new level. These elite stats are available to PFF Elite subscribers, and that’s for good reason: These are the best, most in-depth football stats you’ll find anywhere, and we’re giving you access to both 2016 and 2017 data points.
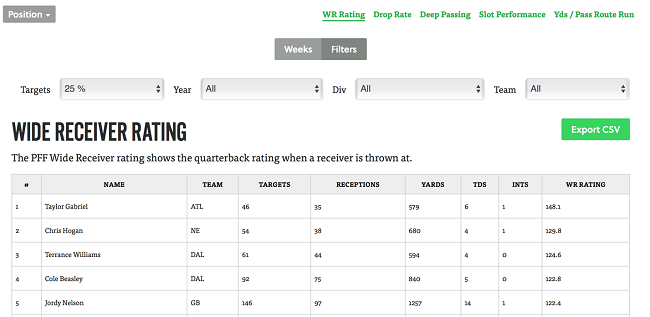
The above image shows wide receiver rating among wideouts who saw at least 25 percent of their team’s snaps last year. (WR Rating shows the passer rating when targeting a particular wide receiver.)
This is just one of the many unique stats available via Signature Stats. You can get data for any player at any position. Seriously — we even have Signature Stats for Centers.
This is one of the most valuable tools in our arsenal, so I’m going to spend a good amount of time going over what it offers.
- Quarterbacks
- QB Rating; Adjusted Completion %; Deep Passing; Under Pressure; Kept Clean; Play Action; Time in Pocket
- Running Backs
- Elusive Rating; Breakaway %; Yards Per Route Run; Drop Rate; Pass Blocking Efficiency
- Wide Receivers
- WR Rating; Drop Rate; Deep Passing; Slot Performance; YPRR
- Tight Ends
- Drop Rate; Deep Passing; Slot Performance; YPRR; Pass-Blocking Efficiency
- Offensive Lines; Offensive Tackles; Offensive Guards; Centers
- Pass-Blocking Efficiency (sacks allowed, hits allowed, hurries allowed, etc.)
- Defensive Tackles; 3-4 Defensive Ends; Interior Defenders
- Run Stop %; Pass-Rush Productivity
- 4-3 Defensive Ends; 3-4 Outside Linebackers; Edge Defenders; 4-3 Outside Linebackers; Inside Linebackers; Linebackers
- Pass-Rush Productivity; Run Stop %; Tackling Efficiency; Coverage
- Cornerbacks
- Run Stop %; Tackling Efficiency; Coverage; Slot Performance; Pass-Rushing Productivity
- Safeties
- Run Stop %; Tackling Efficiency; Coverage; Pass-Rushing Productivity
Like the fantasy stats data, all of the Signature Stats data is exportable via .csv files, which means you can explore the data on your own with software like Microsoft Excel. That’s an extremely powerful feature.
I’m still finding new use cases for Signature Stats. Like with fantasy stats, you can filter for specific weeks to identify treads. You can also find matchups to avoid or exploit based on hyper-specific data points.
For example: In the quarterback section, you can see how each quarterback fares under pressure, and how often they face pressure. Completion rate, touchdowns, interceptions, yardage — it’s all available to see how a quarterback does under pressure vs. without pressure.
You can then navigate over to the defensive stats — interior defenders and edge defenders are a good place to look — to see each players’ pass-rush productivity. Then you just have to fit the puzzle pieces together.
The same can be done for running backs against defensive lines and linebackers. Or wideouts against cornerbacks. Or tight ends against safeties. Or slot wideouts versus slot corners.
Your decisions will no longer be based on “team X vs. team Y,” but based on “player X vs. player Y.”
DFS Lineup Optimizer (Elite)
Our DFS Lineup Optimizer tool has been completely revamped for 2017.
You can build single-entry lineups or multiple lineups all at once. It’s seriously simple. You choose your site (FanDuel, DraftKings, or Yahoo), the week, and the slate. Then you just click “optimize lineup,” and voilá!
If you want to swap out one of the players in the optimized lineup, you can just hit the red “x” on the right side, then hit “select” to choose a new wideout.
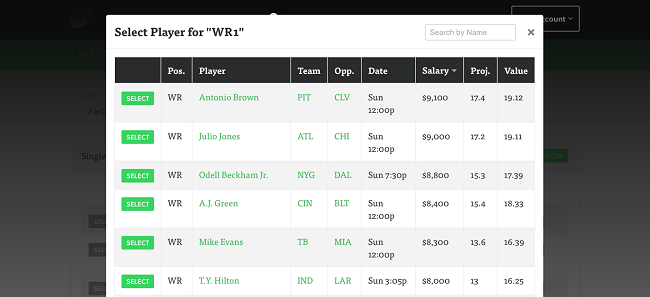
You’ll end up with the full range of available wideouts, sorted by projected points for the week. You can also sort by value — which is their projected points, divided by their salary, multiplied by 10.
If the “select” button is in red, it means you don’t have enough money to fit them into your lineup.
Sorting by value is a fantastic way to find some cheap players who are projected to far exceed their salary-based expectations.
What about building multiple lineups with the tool? This is where the DFS Lineup Optimizer tool becomes exceedingly powerful.
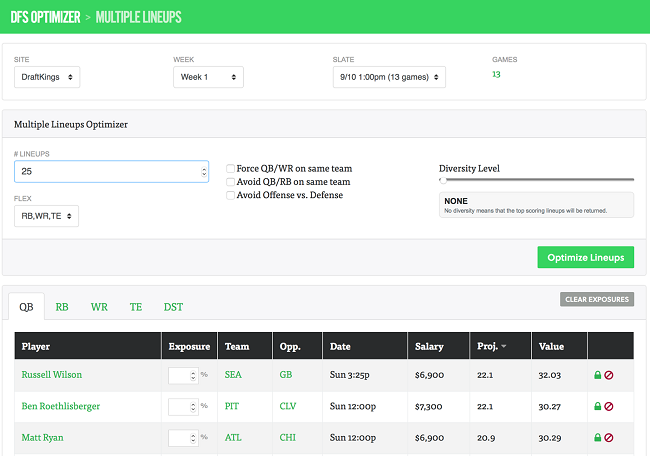
You pick the site, week, and slate, and tell the tool how many unique lineups you want. You can also have the optimizer force QB/WR on the same team (setting stacks for tournaments), avoid QB/RB on the same team, and avoid offense vs. defense. All of these are common DFS tactics and they are built in — optionally — for your use.
You can also choose who to put in the flex spot for DraftKings (WR-only, RB-only, RB/WR, or WR/TE — basically, if you want the lineup optimizer to never put a tight end in the flex spot when building multiple lineups, choose the RB/WR flex setting).
You can also select the diversity level. The “high diversity” setting means you’ll have more unique players sprinkled throughout your lineups. The “no diversity” setting means each one of your multiple lineups will look similar.
You can also lock players in — so that they appear in 100 percent of the lineups — or you can fade players completely, meaning they don’t appear in any of the lineups.
You can also land somewhere in the middle. If you want 30 percent exposure to Russell Wilson, for example, and you build 10 lineups, the system well ensure that three lineups feature Wilson, but no more.
You can sort all players within each position by salary, projected points, and value. Again, as noted before, sorting by value provides you with excellent insight into who to target in DFS in a given week.
Once the lineup optimizer has generated your desired number of lineups, you can export the file as a .csv and upload it to your DFS site of choice, and your lineups will automatically be added to the DFS site.
Weekly WR/CB Matchup Chart (Edge & Elite)
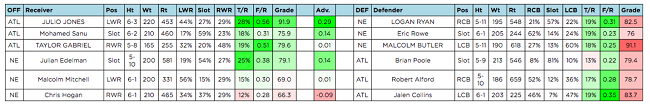
This is the chart to end all charts.
The weekly WR/CB matchup chart details which wideouts will face which cornerbacks in a given week, and clearly spells out how many snaps the wideout and cornerback spend on the right side of the field, the left side of the field, and in the slot.
The chart shows each players’ height and weight to help you identify physical mismatches, and it always shows how often each wideout and corner is targeted per route run, and how many fantasy points they score (or give up) per route. The chart also shows the respective PFF grades of each wideout and cornerback.
The “advantage” column in the middle shows the difference in fantasy points per route scored by the receiver vs. given up by the primary corner he will face that week. It’s color-coded too, to make it easy to identify mismatches at a glance.
This chart alone with worth the PFF Elite subscription ($199.99) — and it’s available to you with a PFF Edge account ($39.99). It’s immensely valuable to DFS players, but it can be used for season-long leagues as well. If you’re struggling to choose between two or three wideouts, you can use this chart to find which one has the best individual matchup that week. The individual matchup is often the most important thing.
The chart is sortable by any of the given columns. You can sort by team and go through the matchups on a game-by-game basis. I usually sort by Advantage to just quickly see which wideouts have the best individual matchups that week.
A quick tip: Pay close attention to how often each player lines up on the right side of the field, left side of the field, and in the slot. If a wideout spends about half of his time on the right side of the field and half of his time on the left, make sure you see how he’ll fare against both corners — not just the one shown on the chart.
Player position tool, for granular snap data (Elite)
PFF Elite members gain access to granular snap data for each player. This tells you who lined up where, and how often. Take a look:
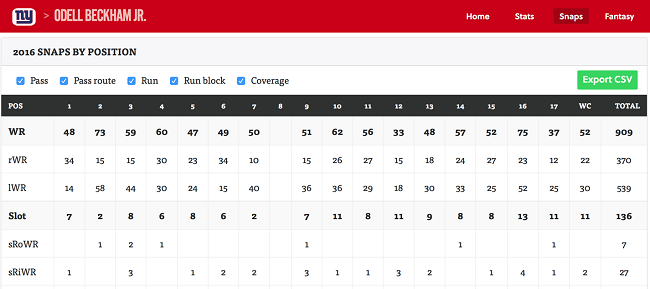
Last year, Odell Beckham Jr. took 909 snaps at wide receiver — but only 136 of those snaps were from the slot. He lined up as the Giants’ left wideout for the majority of his snaps. This is immensely useful when determining which wideout will face which cornerback in a given week — and how often.
The granular running back snap data also shows you where the running back lined up when they were a receiver. The data also shows you how often they lined up as a fullback, and how often they lined up either on the right or left side of the quarterback (or directly behind him).
The snap data also shows you how often a running back or tight end served as a pass- or run-blocker. On passing downs last year, David Johnson ran 549 routes, but was a pass-blocker on just 89 snaps.
As is the theme with most of our tools and data, you can use this tool to find matchup advantages and disadvantages. You can also use the data to simply become a smarter football fan and fantasy player. There are plenty of narratives about players floating around out there. You can use the actual data to find the truth.
For instance, many people believe Danny Amendola will fill in for Julian Edelman this season in the slot. But guess what? Chris Hogan saw 346 pass routes from the slot last season, while Amendola saw 314. You no longer have to blindly follow the narratives.
Fantasy depth chart (Edge & Elite)
The PFF Fantasy depth charts let you quickly know who the next man up will be should an injury occur. It’s not always easy to keep up with depth charts — especially because team websites are often misleading or straight up wrong.
This is a tool you can use to your advantage when scouring the waiver wire each week. If a starter is nursing an injury on Wednesday, you can check out the depth chart to know who would be in line for a boost in targets come Sunday.
Handcuff Index (Edge & Elite)
Not all handcuffs are created equal. Some of them are completely worthless, while some of them have legitimate league-winning potential. The Handcuff Index breaks it down for you.
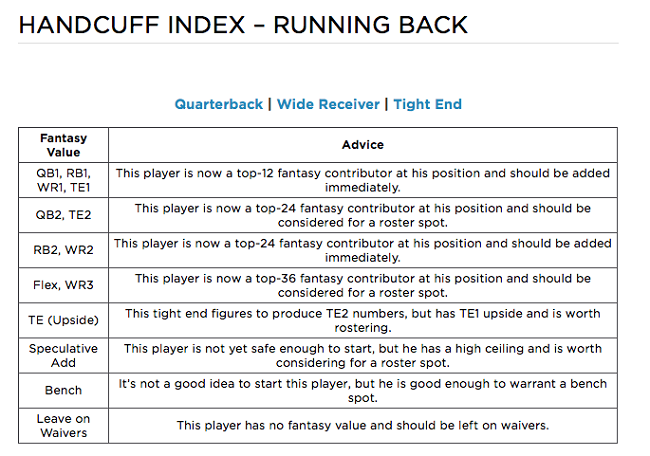
The RB Handcuff Index will be a regular feature article this season, and will detail the movers and shakers in the space.
This is a fantastic tool to help you always be one step ahead on the waiver wire. If you’re in a league that features blind bidding (FAAB), it helps you not waste your waiver wire money chasing ghosts. It’s an essential tool when placing bids on backup players.
Shadow Coverage Matrix (Edge & Elite)
The Shadow Coverage Matrix offers the most detailed look at which cornerbacks “shadow” an opposing team’s wideout. Shadow corners are often overrated, but sometimes, they are to be avoided.
The tool maps each team over the course of the entire season, and gives detailed notes when a “shadow situation” does occur. Some cornerbacks have the reputation of always being a shadow corner, but that’s not always the case. Our tool can help you figure out when they did shadow and what the circumstances were.
This is useful when figuring out which wideouts to play (or avoid) in DFS, and when setting your lineups for season-long leagues.
One of my favorite uses of the Shadow Coverage Matrix is to figure out when an elite cornerback likely won’t be shadowing an opposing team’s No. 1 wideout, despite a popular narrative that it will be the case. For DFS purposes, you’ll know that the wideout’s ownership rates will likely be lower because of the narrative.
This year’s Shadow Coverage Matrix will debut in Week 2.
Projected box scores (Edge & Elite)
The projected box scores tool is another one of my favorites, and I feel like it’s vastly underrated in general.
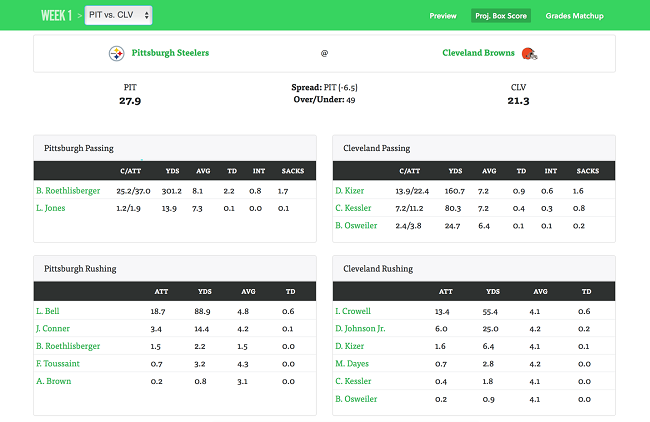
The tool uses PFF’s data-driven projections to break down each game on a player-by-player basis. The tool shows the projected over/under, the projected spread, and each team’s projected point total. This is a great feature when targeting high-scoring games for DFS purposes.
You can use the standard Vegas liens in conjunction with the PFF projected box scores to see which games might be over- or under-hyped in the community.
The projected box score also lets you see exactly how PFF projects each team to score their points in a given week. For example, the above picture details Pittsburgh at Cleveland for Week 1. In DFS, everyone will probably be loading up on Le’Veon Bell. It’s a road game for Pittsburgh, everyone’s favorite narrative is how bad Ben Roethlisberger is on the road, and it’s against Cleveland.
But check out Roethlisberger’s projected yardage and touchdown totals for this game. He’s expected to top 300 passing yards, which would give him the bonus on DraftKings. And Le’Veon Bell is projected for 0.6 rushing touchdowns — the same as Isaiah Crowell.
Does that mean Bell is a bad play? Obviously not. But Roethlisberger might fly under the radar. This tool helps you easily identify these types of opportunities.
Private Facebook group with Q&A access (Elite)

PFF Elite subscribers gain exclusive access to the PFF Elite Facebook group. PFF Fantasy staff members host regular live streams to answer questions from subscribers. Members can also post questions at any time, and they’ll get feedback from the PFF staff. (Community discussion also picks up in the comments! Remember, every one of our PFF Elite subscribers is dedicated to fantasy. We aren’t the only ones you can learn from.)
2018 NFL Draft Guides and scouting reports (Edge & Elite)
This might feel some ways away, but PFF Edge and PFF Elite subscribers will have access to the 2018 NFL Draft Guide and scouting reports.
Actually, they already have access to the guide. That’s right — one already exists. And it’s 222 pages long! Here’s a sneak peak of some of the analysis included in the Draft Guide:
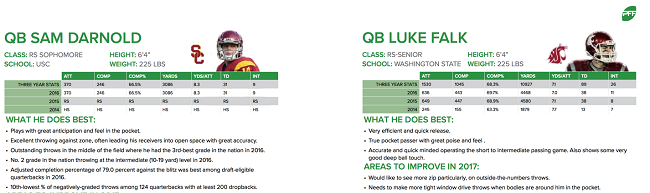
The guide will go through several iterations between now and the 2018 NFL Draft, and our subscribers will have access to each update. This guide helps you understand each players’ strengths and weaknesses before they play a down in the NFL.
222 pages of stats and analysis on next year’s draft class is a lot to digest as you gear up for the 2017 fantasy season, but when the time is right, you’ll be able to dive into stats, trends, and insights about next year’s crop of rookies. This helps you understand which players fit within which schemes, and you’ll be a much more knowledgeable football fan over time.

