A player’s garbage and CG time ratios approximate the sustainability of his overall production, but they are not enough to make fantasy decisions. Two players may receive the same 20 percent ratio of their targets in garbage time, but if one catches five touchdowns in those situations and the other just two, their totals should not be considered equally predictive.
Since the start of this research, my goal has been to devise a method to adjust garbage time numbers to a reasonable estimate of what they would have been in normal game play. It turns out, that is pretty difficult. Even after I completed my win probability model, I ran into three different issues before I was satisfied that I accomplished my goal.
Issue 1 – Fantasy points are not consistent even in normal time
Remember this chart that shows passing and rushing fantasy points per play in various win probability contexts?
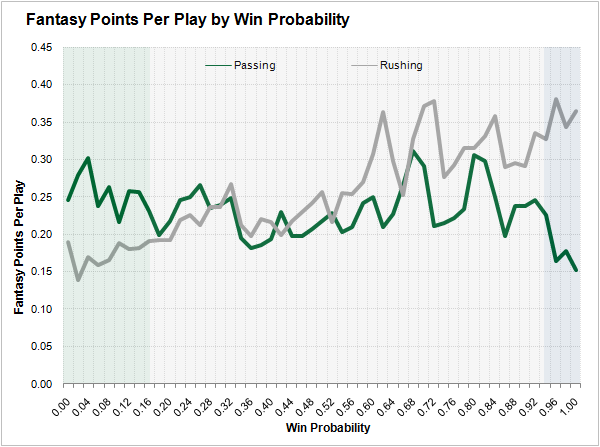
The section with a white background between 17 and 93 percent win probability is what I deemed normal time. In that range, the game is close enough that each team can be expected to use its full playbook and typical ratio of run vs. pass. Despite the similar nature of those plays, fantasy points per play are not equal across the band. More passing and rushing points are scored per play above 50 percent win probability than below 50 percent.
The reason for that isn’t motivation. It’s the players themselves. Players like Aaron Rodgers and Tom Brady make most of their pass attempts above that 50 percent threshold because they are good and their teams are good.
That makes sense, but it creates an obstacle for this analysis. If I averaged the fantasy points per pass around a 65 percent win probability, I’d end up around 0.30 points. If I did the same around a 35 percent win probability, I’d end up with 0.20 points. That doesn’t mean that when a quarterback falls from a 65 percent chance to win to a 35 percent chance to win in a game, he can expect his fantasy points per play to drop by 0.10 points. In addition to measuring the relative difficulty of those contexts, that calculation is also accidentally measuring differences in the quality of players who threw passes in those contexts, which is not what I want to do. Meanwhile, there is a risk that player quality is creating misleading trends in the green zone below 16 percent win probability and the blue zone above 94 percent win probability even though the trends there look like what you’d expect from garbage and CG time.
To work around that issue, I used weighted averages that scaled down each player’s contributions in garbage time, normal time, and CG time to the number of attempts they had in their least frequented context. In practice, that means quarterbacks like Rodgers and Brady contribute less of their normal-time statistics to the collective weighted average comparing garbage time to normal time than quarterbacks like Colin Kaepernick and Jared Goff, who made a lot more attempts in garbage time.
DOMINATE FANTASY FOOTBALL & BETTING WITH AI-POWERED DATA & TOOLS TRUSTED BY ALL 32
 Unlimited Fantasy League Sync
Fantasy Start/Sit Line-Up Optimizer & Waiver Wire
WR-CB & OL-DL Matchups, PFF Player Grades, & Premium Stats 2.0 Tools
Nathan Jahnkes Rankings - #1 Most Accurate Last 70 Weeks
PFF Best Bets, Player Props, & Power Ranking Tools
NFL Mock Draft Sim with Trades & Draft Grades
Unlimited Fantasy League Sync
Fantasy Start/Sit Line-Up Optimizer & Waiver Wire
WR-CB & OL-DL Matchups, PFF Player Grades, & Premium Stats 2.0 Tools
Nathan Jahnkes Rankings - #1 Most Accurate Last 70 Weeks
PFF Best Bets, Player Props, & Power Ranking Tools
NFL Mock Draft Sim with Trades & Draft Grades
Already have a subscription? Log In

