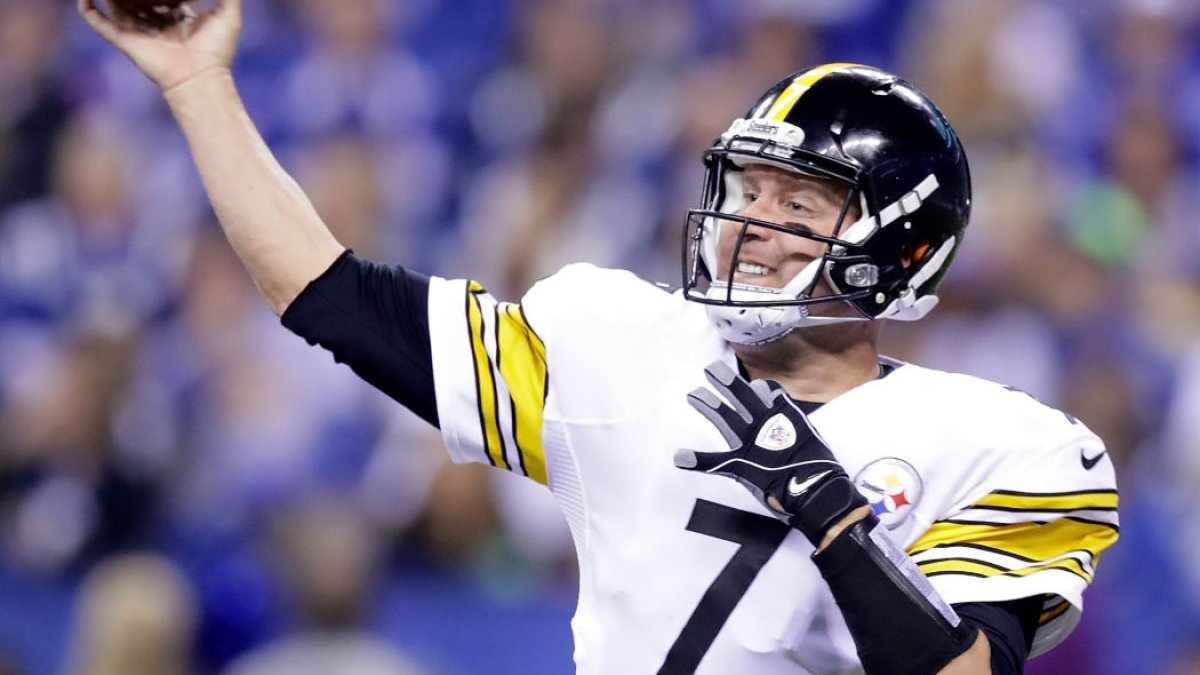
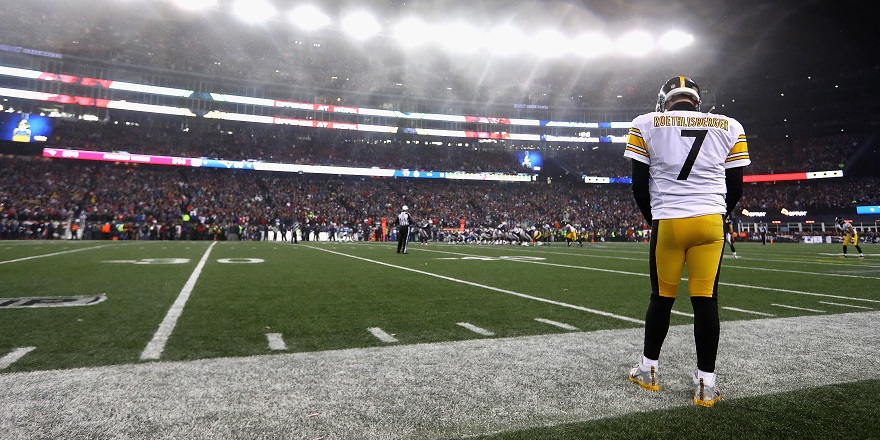
Forget about fantasy football for a minute. Well, maybe that’s a bit harsh. We don’t want to completely forget about the reason you clicked. But what I want you to take away from this article is bigger than just fantasy football. It’s about how we’ve all overrated Ben Roethlisberger and why he may not be the quarterback you thought he was.
This started when I had an itch to find out why it seemed Roethlisberger “busted” so much from a fantasy perspective. When I say bust, I’m referring to games with fewer than 14 fantasy points in standard leagues, which translates to 250 passing yards and one touchdown (or variants on that when turnovers and/or rushing come into play). That’s not too much to ask for from a guy who’s considered one of the greats, right?
It was prior to the 2016 season when I noticed Roethlisberger had a similar bust rate to that of Jay Cutler, which would have raised everyone’s eyebrows. From 2011 through 2015, Roethlisberger played a total of 72 regular-season games, busting in 28 (38.9 percent). To give you a comparison, Cutler played in 66 games, turning in a bust performance in 25 of them (37.9 percent). Others in this range include Alex Smith and Andy Dalton.
I’ve often referred to the last three years when talking about Roethlisberger’s struggles on the road, but it goes back even further than that. In fact, he’s been a mediocre quarterback (at best) on the road throughout his entire career.
Here are a set of numbers for you: 16 games, 3,782 yards, 16 touchdowns and 14 interceptions. Whose numbers are those? Not Roethlisberger. Those are actually rookie Carson Wentz’s numbers over his first NFL season. Here’s another set of numbers: 25 games, 5,289 yards, 27 touchdowns and 25 interceptions. Again, these are not Roethlisberger’s. They are those of Brock Osweiler throughout the last two seasons. Now, let’s take a look at the three of these quarterbacks together on a per-game basis.
| Player | Games | Att/gm | Yards/gm | TD/gm | INT/gm | TD % | INT % | FPts |
| Ben Roethlisberger (Career Road Numbers in PFF era 2006-2016) | 87 | 34.4 | 256.9 | 1.4 | 1.0 | 3.94 | 2.81 | 14.7 |
| Ben Roethlisberger (Last 3 years Road Numbers) | 26 | 36.5 | 270.6 | 1.0 | 0.9 | 2.64 | 2.53 | 13.7 |
| Brock Osweiler | 25 | 34.0 | 211.6 | 1.1 | 1.0 | 3.18 | 2.94 | 11.9 |
| Carson Wentz | 16 | 37.9 | 236.4 | 1.0 | 0.8 | 2.64 | 2.31 | 12.7 |
As you can see, his road numbers have been worse over the last three years, but his career numbers (in the PFF era) aren’t much better. While some will say that it’s typical for quarterbacks to play worse on the road, no elite quarterbacks dip down into the territory of a rookie quarterback or another quarterback who was benched in the first year after getting a $72 million contract.
This alone was not enough to satisfy my curiosity, as I needed to know if Roethlisberger just really struggled in tough matchups and his numbers were dragged down because of this, or if he really was as bad as the numbers seemed to say. To do that, I needed to examine every single game throughout his career in the PFF era and match it up with PFF’s grading system (this is the reason I stuck to the PFF era). So I went through each year, taking note of the opposing defenses pass coverage grade and matching it up with the teams that he played. Below is his game chart against all varieties of defenses.
| Pass Coverage Grade | G | Att. | Comp | Comp % | Yds/gm | Yds / Att | TDs | Ints | QBR | TD % | INT % | FPts |
| Top-6 | 21 | 36.3 | 21.6 | 59.4% | 259.0 | 7.13 | 1.0 | 1.3 | 76.3 | 2.75% | 3.54% | 13.1 |
| Top-12 | 36 | 36.1 | 21.9 | 60.6% | 255.8 | 7.08 | 1.1 | 1.2 | 78.6 | 3.00% | 3.31% | 13.4 |
| Top-16 | 49 | 35.2 | 21.8 | 61.8% | 260.5 | 7.39 | 1.3 | 1.1 | 83.9 | 3.65% | 3.13% | 14.5 |
| Bottom-16 | 38 | 33.3 | 21.8 | 65.5% | 252.2 | 7.58 | 1.4 | 0.8 | 94.6 | 4.35% | 2.37% | 15.1 |
| Bottom-12 | 25 | 33.7 | 22.0 | 65.2% | 259.8 | 7.70 | 1.4 | 0.8 | 94.9 | 4.15% | 2.49% | 15.2 |
| Bottom-6 | 15 | 35.4 | 23.7 | 67.0% | 276.1 | 7.80 | 1.5 | 0.7 | 98.3 | 4.33% | 2.07% | 16.4 |
You can see that he naturally gets better against the lower-graded pass coverages, but not a whole lot, maxing out at 1.5 touchdowns per game with 0.7 interceptions. While that’s not a bad number, it’s against the worst pass defenses in the league. Those numbers get worse over the last three years, but it’s a relatively small sample size. But over his career, that tells us an awful lot.
Most would say that Carson Palmer was a quarterback who under-performed in 2016, as the Cardinals missed the playoffs despite solid defense for most of the year and a huge year from phenom David Johnson. It just so happens that the 2016 version of Palmer is who most resembles Roethlisberger’s career road games against bottom-six defenses. Again, I cannot stress enough that Roethlisberger’s numbers are against the league’s worst pass defenses for that particular year, while Palmer’s are against all of the teams he played in 2016.
| Player | Games | Att/gm | Yards/gm | TD/gm | INT/gm | TD % | INT % | FPts |
| Carson Palmer | 15 | 39.8 | 282.2 | 1.7 | 0.9 | 4.36 | 2.35 | 17.2 |
| Ben Roethliberger (On road vs. bottom-6 pass defense) | 15 | 35.4 | 276.1 | 1.5 | 0.7 | 4.33 | 2.07 | 16.3 |
At this point you’re probably wondering who his comparable player is when he’s playing against a top-six defense on the road. While we are just piling on at this point, this is the point of the article; to give you an idea of how bad Roethlisberger has actually been on the road. His comparable player from 2016 is Case Keenum, who didn’t offer up as many yards per game, but his touchdown and interception percentages were right in line.
| Player | Games | Att/gm | Yards/gm | TD/gm | INT/gm | TD % | INT % | FPts |
| Case Keenum | 10 | 32.2 | 220.1 | 0.9 | 1.1 | 2.80 | 3.42 | 11.3 |
| Ben Roethliberger (On road vs. top-6 pass defense) | 21 | 36.3 | 259.0 | 1.0 | 1.3 | 2.75 | 3.54 | 13.0 |
All of the above numbers include the playoffs as well, as I know some people have asked whether he steps up in playoff time. Including playoffs, you’d have to go back all the way to 2013 in order to find a road game in which he threw for more than one touchdown against a top-12 defense. Of the 36 road games he’s played against top-12 defenses in his career, he’s posted a passer rating of more than 95 just four times. In the 39 games that he’s played at home against top-12 defenses over his career, he’s topped that number an amazing 22 times.
Now that we’ve discussed why Roethlisberger shouldn’t be considered one of the greats because of his road numbers, let’s talk about how good he has been at home. Prior to this research, I would have guessed Roethlisberger’s home splits would have put him among some of the all-time greats.
As it turns out, Roethlisberger is better against top-six pass coverages at home than he is against bottom-six coverages on the road. That legitimately makes no sense. But the proof is in the pudding. Here are Roethlisberger’s stats while playing at home over his career.
| Pass Coverage Grade | G | Att. | Comp | Comp % | Yds | Yds / Att | TDs | Ints | QBR | TD % | INT % | FPts |
| Top-6 | 24 | 32.5 | 20.8 | 64.2% | 266.5 | 8.21 | 1.8 | 0.6 | 97.0 | 5.39% | 1.80% | 17.1 |
| Top-12 | 39 | 32.9 | 21.1 | 64.1% | 265.5 | 8.07 | 1.7 | 0.8 | 95.4 | 5.30% | 2.49% | 16.8 |
| Top-16 | 49 | 33.7 | 21.5 | 63.8% | 268.7 | 7.98 | 1.8 | 0.9 | 94.3 | 5.21% | 2.67% | 16.9 |
| Bottom-16 | 37 | 32.2 | 21.2 | 65.8% | 268.2 | 8.32 | 2.1 | 0.7 | 104.8 | 6.54% | 2.18% | 18.5 |
| Bottom-12 | 27 | 32.3 | 21.3 | 66.1% | 273.6 | 8.47 | 2.1 | 0.8 | 104.9 | 6.42% | 2.52% | 18.4 |
| Bottom-6 | 12 | 31.8 | 21.3 | 67.2% | 282.3 | 8.89 | 2.1 | 0.4 | 112.7 | 6.56% | 1.31% | 19.2 |
It’s pretty amazing when looking at these in the grand scheme of things, because his numbers are great across the board, almost regardless of which defense he plays. The totals come out to 269 passing yards per game with 1.91 touchdowns and 0.81 interceptions per game. Over the span of an entire 16-game season, those numbers extrapolate to: 4,296 passing yards, 31 touchdowns and 13 interceptions. What does that comparable look like? Andrew Luck in 2016 where he played 15 games, he posted 4,240 yards, 31 touchdowns and 13 interceptions.
As we can see by this, even if Roethlisberger had played at home his entire career, his numbers would look like 2016 Andrew Luck’s total numbers (not just home), who played behind the league’s 30th-ranked offensive line in pass-blocking. Roethlisberger played behind the No. 2 offensive line in pass blocking in 2016. He was pressured on just 23.1 percent of his dropbacks this year, which was the least among starting quarterbacks. Luck was pressured on 44.4 percent of his dropbacks, the second-most in the league. When under pressure, Roethlisberger’s passer rating was just 66.5, which ranked 15th among the 28 quarterbacks who played at least half of their team’s snaps.
From a fantasy standpoint, this helps explain why Roethlisberger has never finished as a top-three quarterback, and why he has finished inside of the top 10 just three times in his 13-year-career. Some may point to the fact that he’s played 16 games just three times, but that’s also a problem, and one to discuss another day.
When someone argues that Eli Manning is an all-time great on the basis of his two Super Bowls, we all know how to counter that. Roethlisberger, who also has two rings, gets talked about in glorified tones as well, but these numbers show that his reputation might be as undeserved as Manning’s.


 © 2024 PFF - all rights reserved.