Yards per carry is a popular statistic for fantasy football analysis, even if it is woefully incomplete. It’s inherently biased, favoring running backs with better than average offensive lines, running backs who see a high percentage of carries against poor run defenses, running backs who see a high percentage of carries against lighter defensive fronts, or running backs who might be inconsistent but compile a high percentage of their yardage on relatively few carries. Like all statistics, it’s one that’s much better served when looking at it with more context, and that’s what we’re going to do here today.
I looked at the running backs through the lens of elusive rating last time around. With the superior metric already covered, let’s turn back to yards per carry and look at three different ways we can make it more meaningful:
Yards per carry by run length
The first chart we’ll look at is sorted by a running back’s yards-per-carry average, but breaks it down by what percentage of runs went for 1 or more yards, 3 or more yards, 5 or more yards, etc. This can help to measure consistency and spot regression. Over the past two seasons, by using this metric, we accurately identified Leonard Fournette (2017) and Isaiah Crowell (2016) as top regression candidates.
Here’s every running back with at least 125 carries in 2018:
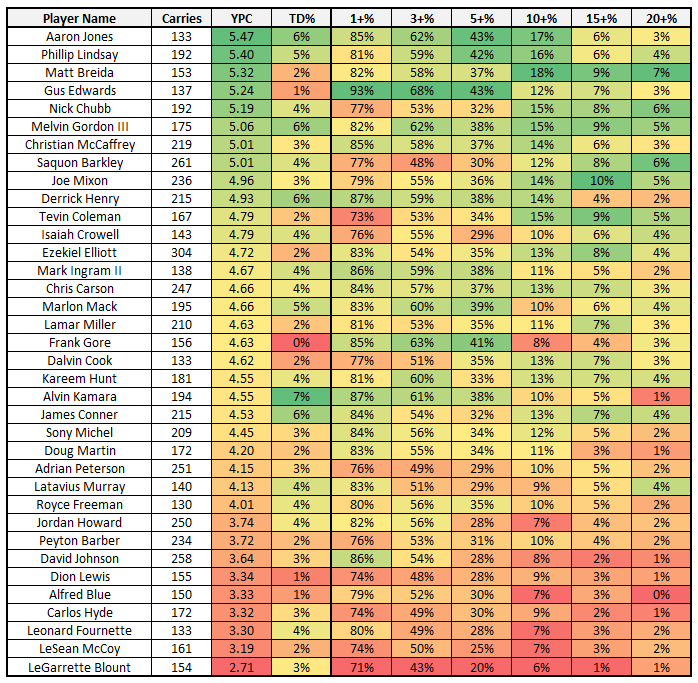
In order, Gus Edwards, Alvin Kamara, Derrick Henry, Mark Ingram, David Johnson, Aaron Jones, Christian McCaffrey, and James Conner ranked highest in percentage of carries to gain positive yardage. In each instance, I feel good about their potential to return a high yards per carry next season.
Matt Breida, Saquon Barkley, Nick Chubb, Melvin Gordon, Tevin Coleman, Joe Mixon, Ezekiel Elliott, and Phillip Lindsay were among the running backs most heavily reliant on long runs. In some cases, these rankings speak a player’s innate ability as a true home-run threat. In other instances, and sometimes in both cases (Barkley), we should be looking at this and projecting a regression to the mean. Specifically, we should be looking at the four running backs who averaged a run of 20-plus yards on over 5% of their carries: Breida (6.5%), Barkley (6.1%), Chubb (5.7%), and Gordon (5.1%).
In the PFF era (2007-2018) there have been 25 instances of a running back totaling at least 100 carries and averaging a 20-plus-yard run on over 5% of his carries, and also drawing at least 100 carries in the subsequent season. On average, these running backs averaged a 20-plus-yard run on 6.2% of their carries in the first season, but that number fell to 2.8% in the following year. For perspective, the league average rate is 2.6%.
That might not seem like a massive differential, but it adds up. Last season, Barkley totaled 641 yards on 16 carries of 20-plus yards. If you cut those numbers in half, his yards per carry would have fallen from 5.01 to 3.90.
On the opposite end of the spectrum, we should also expect someone like Kamara to also regress closer to the mean. He averaged a 20-plus yard run on only 0.5% of his carries last year, though that number was 4.2% in 2017.
Yards per carry compared to teammates
Another way of breaking down yards per carry is by looking at how different running backs fared when compared to their teammates. Though different running backs are used in disparate ways even on the same team, they are likely running behind the same offensive line and taking handoffs from the same quarterback. Here are the top-20 and bottom-20 running backs (min. 75 rushing attempts) who stood out most compared to their peers:
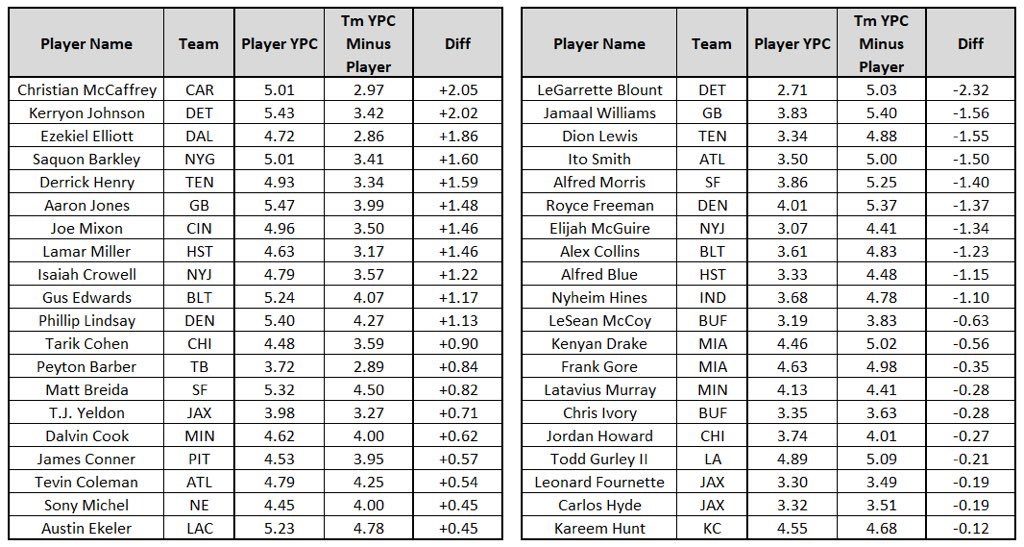
Last season, McCaffrey averaged 5.01 yards per carry while all Panthers running backs averaged just 2.97 yards per carry. Clearly, it’s easy to see why he led the position in snaps last season. In February, head coach Ron Rivera toyed with the idea of lightening McCaffrey’s workload in 2019, but has since walked that back.
Kerryon Johnson ranked second on this list (+2.02) while LeGarrette Blount ranked last (-2.32), and, still, Johnson averaged only 2.2 more carries per game. Head caoch Matt Patricia and GM Bob Quinn have remained steadfast in their stated desire to use their running backs in a committee, so, though Johnson should also run circles around C.J. Anderson this year, their carry totals might not be too different.
Derrick Henry averaged 1.59 more yards per carry than his teammates, and, specifically, 1.55 more yards per carry than Dion Lewis. Even so, Lewis outsnapped Henry 600 to 401 last season, partly due to Henry's ineptitude as a pass-catcher. That’s a concern, though I’d still expect Henry to assume a slightly larger workload next season, especially after totaling 585 rushing yards across his final four games.
On the opposite end of the spectrum, Leonard Fournette (-0.19), Todd Gurley (-0.21), Jordan Howard (-0.27), Latavius Murray (-0.28), Kenyan Drake (-0.56), and LeSean McCoy (-0.63) all posted rather significant negative returns.
Yards per carry over expectation (based on strength of schedule)
Standard yards per carry also does a disservice to running backs who see a high percentage of their carries against tough run defenses. The next statistic we’ll look at builds out a yards-per-carry expectation by looking at each carry, which team that carry was against, and that team’s yards-per-carry average allowed during the 2018 season. Here were the running backs who ranked top-15 and bottom-15 in yards per carry over their expectation (min. 100 rushing attempts).
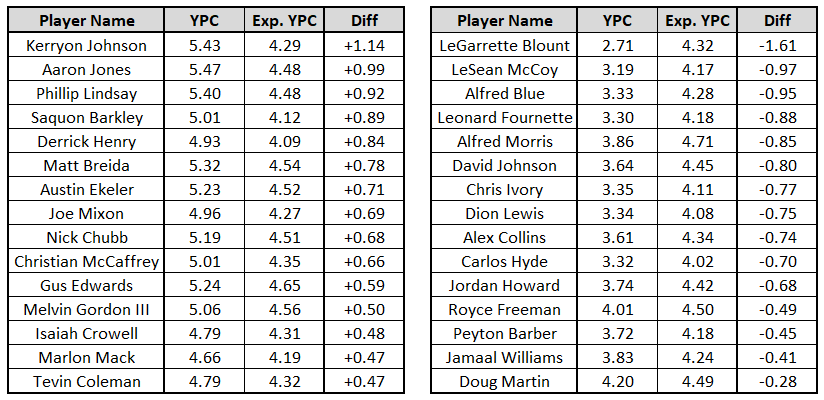
Johnson’s schedule was just about average with a 4.29 yards-per-carry expectation but he rose well above it (unlike Blount). Still, as outlined earlier, in his case, that doesn’t necessarily mean he’ll receive more work in 2019, though he’s certainly deserving.
Barkley and Henry rose well above brutal schedules to rank top-five on this chart. Barkley had the fourth-toughest and Henry the fifth-toughest strength of schedules last year. Similarly, Kenyan Drake had the sixth-toughest strength of schedule and still ranked top-20.
On the other end of the spectrum, Melvin Gordon (fourth-easiest), Nick Chubb (seventh-easiest), James Conner (ninth-easiest), and Aaron Jones (12th-easiest) all had the benefit of a softer strength of schedule.
Of the biggest losers on this chart, LeSean McCoy (-0.97), Leonard Fournette (-0.88), David Johnson (-0.80), and Dion Lewis (-0.75) stand out.

