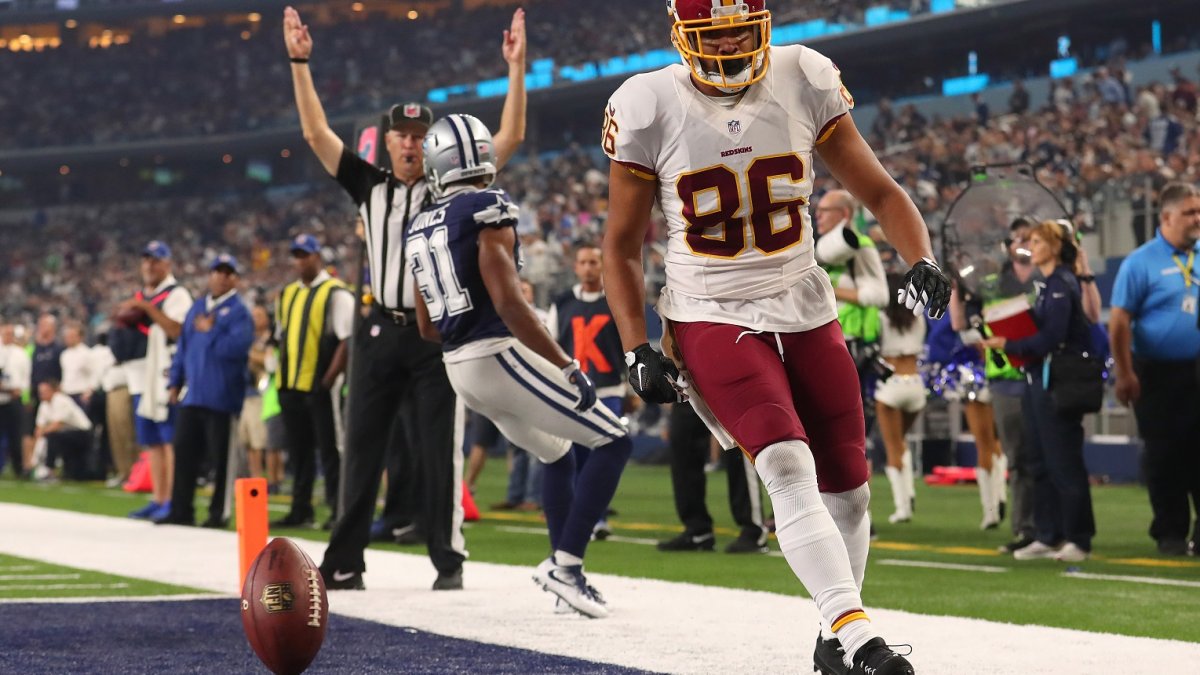
In the Cowboys’ Week 12 victory over the Redskins last year, Ezekiel Elliott scored his second touchdown of the day to increase Dallas’ lead to 31-19 with six and a half minutes left to play. The Redskins had basically lost, but on their ensuing drive, Jordan Reed still caught six passes for 42 yards and a score. When the Redskins failed to recover their onside kick, the Cowboys ran a few more plays, and then Dak Prescott kneeled twice to end the game.
There was little at stake in the last two drives of that Cowboys vs. Redskins game, but that didn’t stop Reed from adding 10 fantasy points (16 in PPR formats) to his ledger. They were scored in what fantasy players commonly call “garbage time.” That means those points didn’t help the Redskins win a game even though they definitely helped me secure a playoff berth in one of my fantasy leagues.
Fantasy players talk about garbage time fairly often, but it is nebulously defined. Some players would point to situations where the offensive team is down multiple scores with only a few minutes left in the game. More would simply state that we all know it when we see it. People’s definitions may be different, but they all intimate the same general concept: garbage time is any situation where the offensive team has little chance to win the game.
By defining garbage time generally, I believe I’ve actually made it easier to define specifically. They key to that is win probability. Baseball fans may be more familiar with the term. There are a number of different models out there, but they all estimate the likelihood that a given team will win the game they are playing based on the state of the game — what inning it is, how many baserunners there are, how many outs there are, and what the score is.
In football, it’s much more challenging to create a win probability model because there are a lot more game states. The model I developed for this research limits its evaluation to six factors — the total time left in the game, whether the offensive team is the home team, the down, the distance from a first down, the distance from the end zone, and the score differential — and by my count, there were 31,314 different game states in 2016 alone. And if you throw out the 1st and 10s on the 25-yard line with 60:00 minutes left, no game state was repeated more than five times.
Rather than try to logically group those factors, I decided to estimate win probability with an extreme gradient-boosting model. Extreme gradient boosting is an example of a machine-learning algorithm that is similar in nature to decision-tree models like random forests. Decision-tree models work by repeatedly partitioning the model training data at the most critical value of the most critical factor.
My model is using the aforementioned six factors to estimate whether the offensive team will eventually win the game. It might start by saying that splitting the data into groups of plays with above 10 points of score differential and below 10 points of score differential produces the greatest difference in win probability between the two groupings. Then, it might take the former group and split it on plays with more than 8 minutes left in the game and plays with less than 8 minutes left in the game. Those decision trees continue to be built on one another until the data is finely partitioned, and multiple versions of the forests are created such that the best-performing forest eventually becomes the model.
For my model specifically, either score differential or total time left is the critical tree factor almost 75 percent of the time. Still, all six variables prove useful in certain situations. For example, early in games when teams are tied at 0-0, being the home team becomes a more important predictor. Later in close games, the offense’s distance from the end zone becomes more important as a proxy for likelihood they will score some points to pull ahead.
With a model in hand, I started to run through various performance statistics split by win probability. Certain things jumped out. For example, take a look at how a team’s pass percentage (percentage of total plays that are passes instead of rushes) decreases as their chance of winning increases.
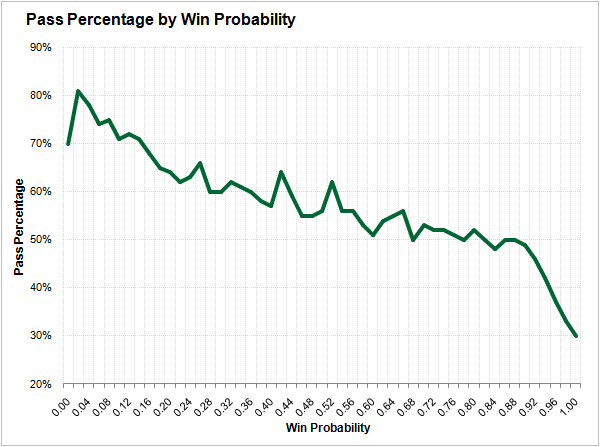
When a team has very little chance to win, they throw upward of 80 percent of their plays. Meanwhile, as their chance to win approaches 100 percent, their pass percentage falls off precipitously, bottoming out at close to 30 percent.
With pass percentage alone, I felt I could have made a reasonable guess at what collection of win probabilities could fairly represent garbage time. However, passing and rushing fantasy points per play tell slightly more complicated stories.
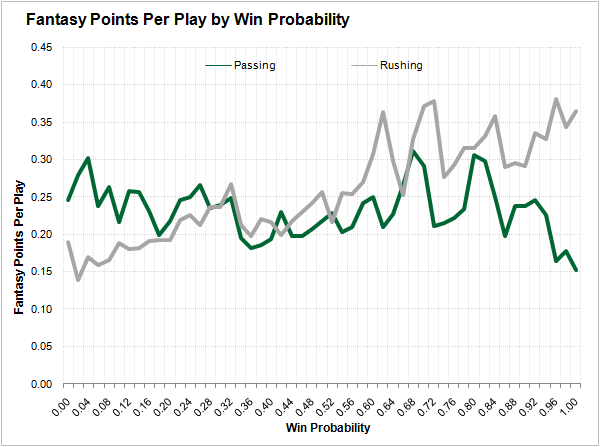
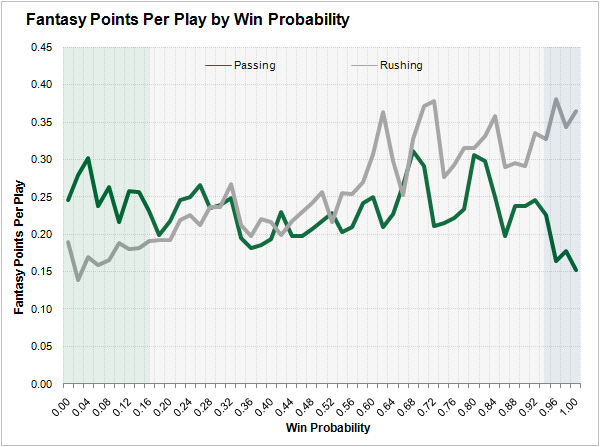
Overlooking the blip near 0 percent win probability, passing points per play start around 0.30 and decline somewhat steadily toward 0.18 around a 36 percent win probability. At the same time, rushing points per play increase from 0.14 to 0.26. From that point, passing and rushing level off for a bit, but then they both increase in waves at around a 60 percent win probability before a distinct final period of increasing rushing production to about 0.36 points per play and decreasing passing production to 0.15 points per play as offenses put away blowout games.
My working theory on why passing and rushing production increases at around a 60 percent win probability is that better teams are more likely to find themselves on that side of 50 percent. Tom Brady and Aaron Rodgers should produce better fantasy numbers than Ryan Fitzpatrick and Blake Bortles whether in low, mid, or high-leverage situations. I’ll test and try to account for that in a future article when I look at individual player performance in garbage time. For now, I believe I can put it aside because, despite that murky middle, garbage time and its inverse are fairly clear at the extremes.
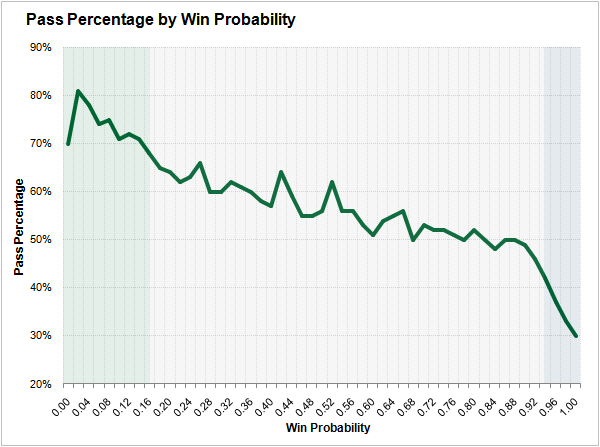
I’m calling any game state at or below a 16 percent win probability garbage time. Then, I’m calling any game state at or above 94 percent win probably counter-garbage time, or CG time.
I’ve added some translucent coloring to the previous two charts to better illustrate those two situations. Garbage time is colored green while CG time is colored blue. First, here’s the pass percentages chart.
And here is the passing and rushing fantasy points per play chart.
With garbage and CG time defined, it is now possible to evaluate the performances of players in those situations to determine how much context drove their success or lack of success. If the overall trends are any indication, I expect there to be some significant differences between players.
–
While I was working on this article, Michael Salfino published an interesting article on garbage time over at FiveThirtyEight. If you found this one interesting, then I definitely recommend you check out his work, too.

