The passing game determines most of what actually happens in the NFL. While finding, developing and keeping solid players at the quarterback position has been, and will likely always be, the most important aspect of sustainable success, acquiring players that can defend the pass is of substantial importance.
While rushing the passer is certainly part of what makes a good defense, we’ve found that coverage has a bigger impact overall on winning games, both from the perspective of expected points at the play level and points allowed at the game level. Thus, finding players that can cover receivers, tight ends and running backs at the NFL level is paramount to curbing passing games and having success on the defensive side of the ball.
With the NFL draft just a few short days away, we’re continuing in our series of deep dives into what Pro Football Focus data at the college level means as it translates to the NFL level. We have three years of college grades for coverage men that have played at the NFL level, and 170 players that have college data and at least 100 coverage snaps at the NFL level. Initial results are encouraging, as the correlation between coverage grade at the college level and at the pro level for all players has been 0.28, which is significantly smaller than that for pass rushing or run defense, but on par with what we see for pro players season-to-season. How a player grades as the primary coverage player is a little less predictive (0.21) from college to pro, but his completion percentage allowed (0.53) and yards after the catch allowed (0.52) are pretty predictive, as is the is ability to break up passes on a per-snap basis (0.40).
Now, combining all coverage players into one group has one (and only one) advantage, which is to increase the sample size. We know, using our expected points model, that coverage from each position type is not created equally. For example, a 0-graded play by a slot cornerback is worth slightly more expected points added for a defense than for an outside cornerback, but the difference between a +0.5 and a -0.5 grade is larger for outside cornerbacks. The value inherent in expected plays and the difference between good- and poorly-graded plays is larger for a defense when it comes from a cornerback (of either type) than a linebacker or a box safety. Expected plays from a deep safety are not as valuable as they are from a cornerback, but the difference between well-graded and poorly-graded plays is larger (but less frequent).
By position
When we look at the ability to predict efficacy in coverage at the pro level, we see (upon first blush) that PFF grades do a better job at predicting future performance for players that play outside cornerback (black line) and safety (green) at the pro level than they do for box players (blue) and slot cornerbacks (red).
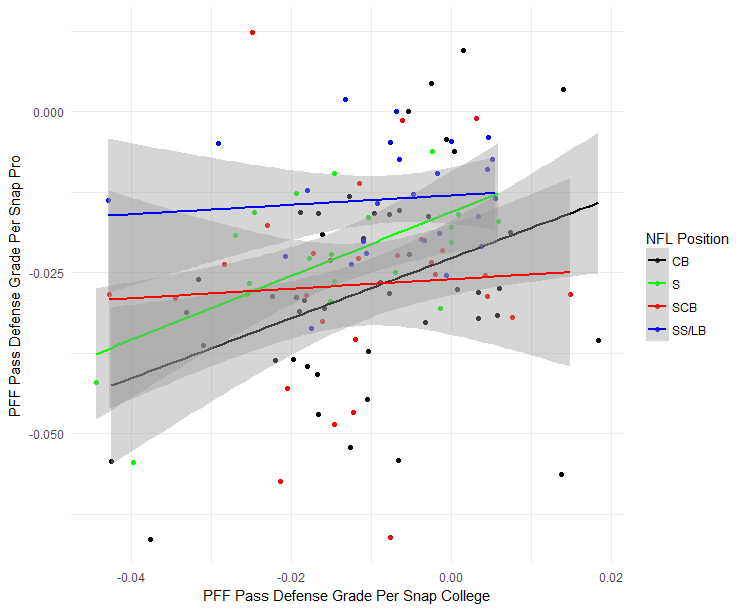
However, there’s a bit more to the story than this. Using a clustering algorithm on our player participation data, we were able to classify players by the position they played as college players and as NFL players. We found that, of the 46 players classified as outside cornerbacks at the NFL level, 40 were classified as such at the college level. On the other hand, of the 28 players classified as slot cornerbacks, only eight were given such a classification at the college level. Thus, it makes perfect sense that an outside cornerback would be easier to project, since he likely doesn’t have to change positions at the next level. Additionally, of the eight players that were slot cornerbacks at both levels, four were undrafted free agents, and the other four were picked in Round 5 or later. Safeties and box players are roughly equally-likely to play the same position in the pros as they did in college.
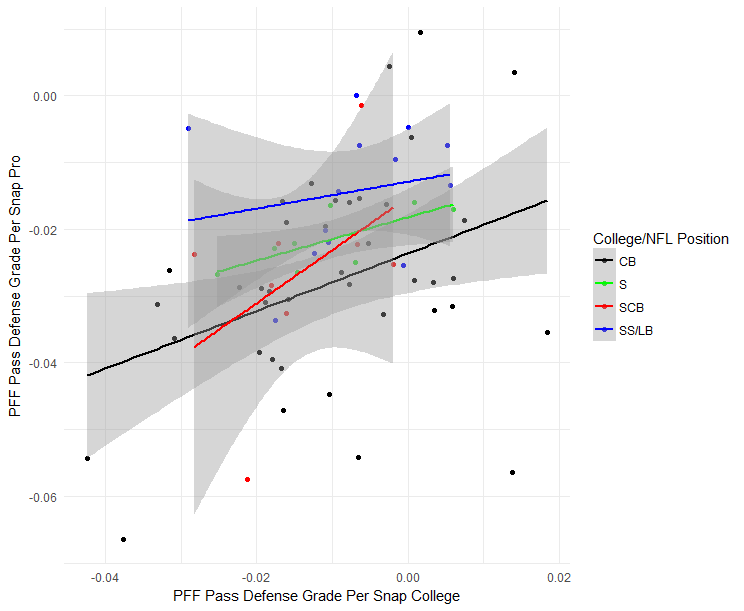
To control for this, we subsetted only by players who played in the same position cluster in college as they did in the pros, and found (in each case) that the ability to predict efficacy at the NFL level increased. For example, the correlation between pass coverage grades at the college level and at the pro level increased to 0.32, while that for the pass breakup rate increased to 0.48. PFF coverage grades for all position clusters appear predictive from college to pro, as seen below.
Can combine data alone predict pro production
Given the results of college to pro stability, the next step was to see if combine data provides any predictive power on it’s own and if it can add to the stability of college to pro grades.
Combine data on its own was fairly useless in terms of true pro grade prediction. Using a player’s position and their combine metrics we were able to reach an R-squared value of just 0.09 on a sample of 900 players that were split into a training, validation, and test sets (0.11 when limited to only those that were drafted). Similarly, trying to predict whether a player will grade above or below the NFL average for his position is completely futile. We tested multiple classification models and none were able to use combine data to predict whether a player would grade above or below his positional average substantially better than simply picking the most likely outcome based on the sample proportion. Also noteworthy is that the round in which a player was drafted explained very little of the variance in PFF grade at the NFL level, when we added this variable to our set of predictors the R-squared value increased to just 0.12 (including draft pick didn’t increase this at all – TRADE DOWN FOLKS).
Combine data and college production
Having come away from looking at combine data alone we’ll go back to looking at the subset of players that have PFF production grades in both college and pro. This shrinks the data set considerably, making any real attempt at prediction with an out-of-sample test set. Before diving into a slightly different approach for analyzing stability with players at various positions and athleticism, we simply looked at the difference in correlation with and without college PFF grade added to our set of predictors. Using combine numbers and college grade gave a correlation of 0.38 on all positions while taking the grade out resulted in a correlation of 0.22 for this set of 130 players with combine data and PFF college grade (correlation of college grade to pro grade was 0.29). These increased to 0.47 and 0.27 when the players played the same position at both levels (86 players).
Our next approach was to build athletic profiles for players and see whether any of them showed increased signs of college grade to pro grade stability. First, we clustered college players in each of the positions groups based on their athletic traits, namely their height, weight and combine numbers. Concretely for the 49 college players whose player participation put them in the CB position we arrived at four athletic profile clusters.
| Cluster | Players (same position) | AVG WT | AVG 40 | AVG HT | AVG VERT | College to pro grade stability | Same position grade stability |
| 1 | 17 (7) | 191 | 4.50 | 5’10.5” | 35.0 | R = 0.34 | R = 0.68 |
| 2 | 7 (4) | 197 | 4.41 | 5’11.9” | 39.7 | R = 0.01 | R = 0.61 |
| 3 | 13 (7) | 189 | 4.46 | 5’11.1” | 37.3 | R = 0.27 | R = 0.54 |
| 4 | 12 (9) | 204 | 4.55 | 6’0.7” | 33.9 | R = 0.18 | R = 0.22 |
Cluster 1 comes away as the most stable from college to pro, with players who remain at outside corner at the NFL level seeing increased stability (though the sample is quite small). Before we go any further, it’s worth noting that there is some bias in looking at players who stay at the same position as this implies a certain level of success may be the reason, how well our data is able to predict if a player will prevail at his college position is beyond the scope of this article but is on the list of future research topics. For now, we will assume that the pre-draft scouting process should be able to do a decent job at identifying these players. Looking at a couple of players in the first cluster that maintained their position we find both Marcus Peters and Tre’Davious White who are both playing at a high level so far in the NFL after performing well in college.
Next up are the slot corners. In light of the recent work we’ve done that looks at the value of slot targets in the NFL, it will be interesting to see what sort of insight we can glean from college production.
Unfortunately the sample size is small to begin with and after using principal component analysis and a mathematical technique to find the optimum number of athletic clusters, we arrive at four groupings that further limits the sample size. That being said, there are still some interesting things to note.
| Cluster | Players (same position) | AVG WT | AVG 40 | AVG HT | AVG SHUTTLE | College to pro grade stability | Same position grade stability |
| 1 | 5 (2) | 196 | 4.49 | 5’9.4” | 7.08 | R = 0.68 | R = 0.56 |
| 2 | 2 (0) | 215 | 4.64 | 6’0.2” | 6.98 | ||
| 3 | 4 (3) | 189 | 4.54 | 5’10.5” | 6.77 | ||
| 4 | 5 (1) | 210 | 4.45 | 6’0.2” | 6.98 |
The most interesting takeaway is the stability that playing slot corner in college has regardless of whether the player stays at that position or changes. The four players who have ended up in the outside corner NFL cluster, Jalen Ramsey, Jalen Mills, Briean Boddy-Calhoun and Chidobe Awuzie are all either performing well or have shown promise. And the players who remained in the slot, despite being considered lowly prospects as already noted, have remained pretty stable with Justin Coleman and Mike Hilton among the group of undrafted free agents who appear to have found a place in the NFL.
With the samples in the other two positions more scarce even than slot corners, we will suffice it to say that players who remain at the same position at the NFL level have, unsurprisingly, seen their grades remain more stable from college to pro.
Players to watch in the draft
The major result here is that grades are more stable for players that remain at the same position which they played in college.
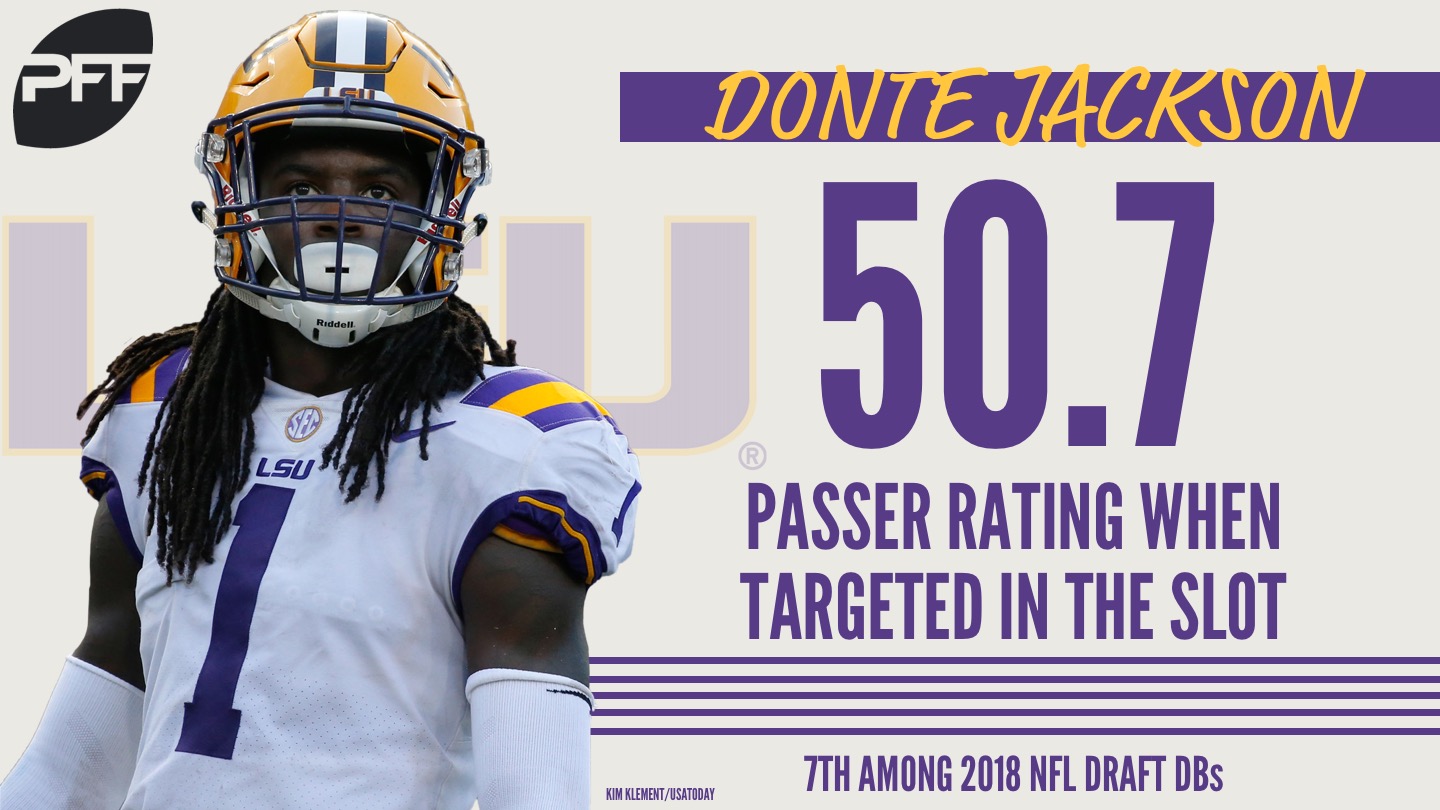
Having already discussed Minkah Fitzpatrick in a previous article, we’ll look at a couple of other player that have shown skill in the slot. Donte Jackson from LSU played primarily in the slot and surrendered a passer rating of just 50.7 when targeted in the slot (seventh in the class) making a compelling case that NFL slot success could be in his future.
Kyzir White played slot corner in college on 64.0 percent of his snaps and surrendered just a 66.3 passer rating on those plays, White is listed at safety and may very well end up as a strong safety/linebacker hybrid. His success in the slot bodes well for success at a different pro position.
At outside corner, a few players that fall into the most stable cluster are Mike Hughes, Jaire Alexander and Josh Jackson. Each rank inside the top-seven on PFF’s big board and figure to remain on the outside.
For more college to pro discussion listen to the PFF Forecast and send questions for @PFF_EricEager and @PFF_George to answer on the podcast by submitting a review on iTunes.

