 From time to time, I’ll look back at old research articles to see if any statistical categories were more predictive than others.
Last year’s version of this article certainly proved valuable. LeGarrette Blount, DeMarco Murray and Mark Ingram were arguably the three running backs who stood out the most. All three were obviously terrific in 2014. Blount averaged 4.4 yards per carry with New England and finished tops in the NFL in fantasy points per snap for the second consecutive season (seriously…that includes quarterbacks). Murray was fantasy’s top running back and was, once again, dominant vs. opposing base defenses (more on that later). Ingram scored nine touchdowns and took advantage when actually given an opportunity to run against nickel defenses (4.8 YPC).
Meanwhile, the likes of Bilal Powell, Steven Jackson, Doug Martin, Bernard Pierce, Maurice Jones-Drew and Trent Richardson showed poorly in last year’s version. Aside of Jackson, everyone on this list disappointed in 2014…and Jackson’s 3.7 YPC wasn’t particularly good. He was cut during the offseason.
The point of laying this groundwork is to present a theory that there may be a correlation between a player’s effectiveness vs. opposing base defenses and the sustainability of success. In this piece, I’m going to take a thorough look at what transpired during the 2014 season and you can bet I’ll be checking on the results come December.
In the event that you didn’t click the above link and are still wondering what I’m even talking about, I give you the following graph/chart combo:
| # of DBs | YPC | Att. |
| 1 | 0.6 | 97 |
| 2 | 1.1 | 299 |
| 3 | 2.1 | 1233 |
| 4 | 4.1 | 22676 |
| 5 | 4.6 | 11178 |
| 6 | 5.7 | 1522 |
| 7 | 7.8 | 52 |
 What this shows is clear correlation between the number of defensive backs on the field and YPC. In fact, compared to last year’s numbers, we see some interesting trends. Last year’s chart included the 2008-2013 seasons and showed a 4.2 YPC vs. base, 4.6 vs. Nickel and 5.6 vs. Dime. This year’s chart includes the past three seasons (2012-14) and shows a slight dip in production against “heavier” defensive sets and increased efficiency against Dime and Quarter. Note that I only used carries by tailbacks who lined up in the backfield. The sample was just over 37,000 carries.
Now that we have an “expected” YPC based on defensive personnel, we can apply it to each carry from the 2014 season in order to determine which backs’ actual YPC outperformed their expected by the largest margin. Only backs who carried the ball at least 100 times are included.
| Rk | Tailback | Carries | Actual | Expected | Diff |
| 1 | Justin Forsett | 274 | 5.2 | 4.2 | 1.0 |
| 2 | Lamar Miller | 208 | 5.2 | 4.5 | 0.8 |
| 3 | Jeremy Hill | 233 | 4.9 | 4.2 | 0.8 |
| 4 | Jamaal Charles | 203 | 5.0 | 4.2 | 0.8 |
| 5 | Jerick McKinnon | 113 | 4.8 | 4.2 | 0.5 |
| 6 | DeMarco Murray | 435 | 4.7 | 4.2 | 0.5 |
| 7 | Le'Veon Bell | 287 | 4.7 | 4.3 | 0.4 |
| 8 | Marshawn Lynch | 341 | 4.7 | 4.3 | 0.4 |
| 9 | LeGarrette Blount | 172 | 4.3 | 4.0 | 0.3 |
| 10 | Eddie Lacy | 284 | 4.6 | 4.4 | 0.3 |
| 11 | Arian Foster | 255 | 4.7 | 4.5 | 0.3 |
| 12 | C.J. Anderson | 195 | 4.7 | 4.5 | 0.2 |
| 13 | Jonathan C. Stewart | 190 | 4.3 | 4.2 | 0.1 |
| 14 | Frank Gore | 254 | 4.3 | 4.2 | 0.1 |
| 15 | Tre Mason | 179 | 4.3 | 4.3 | 0.1 |
We see plenty of familiar faces on this list. Charles, Murray and Blount were each top-five in this category last season. The heart of the chart is full of talent, including Le’Veon Bell, Marshawn Lynch, Eddie Lacy and Arian Foster. A trio of rookies made the list, including Jeremy Hill and Jerick McKinnon in the Top 5.
Of course, the big winner is 2014 breakout performer Justin Forsett. Forsett actually sits at a +0.7 for his career, but hadn’t received enough of a workload to garner much attention. That all changed when he was handed the ball 274 times in 2014. Forsett averaged an astounding 5.2 YPC against base defenses (second-best), which accounted for 75 percent of his carries. He was equally as impressive against Nickel, averaging 5.5 YPC on 54 tries. Forsett turns 30 this year, but he’s one of the league’s most-efficient backs.
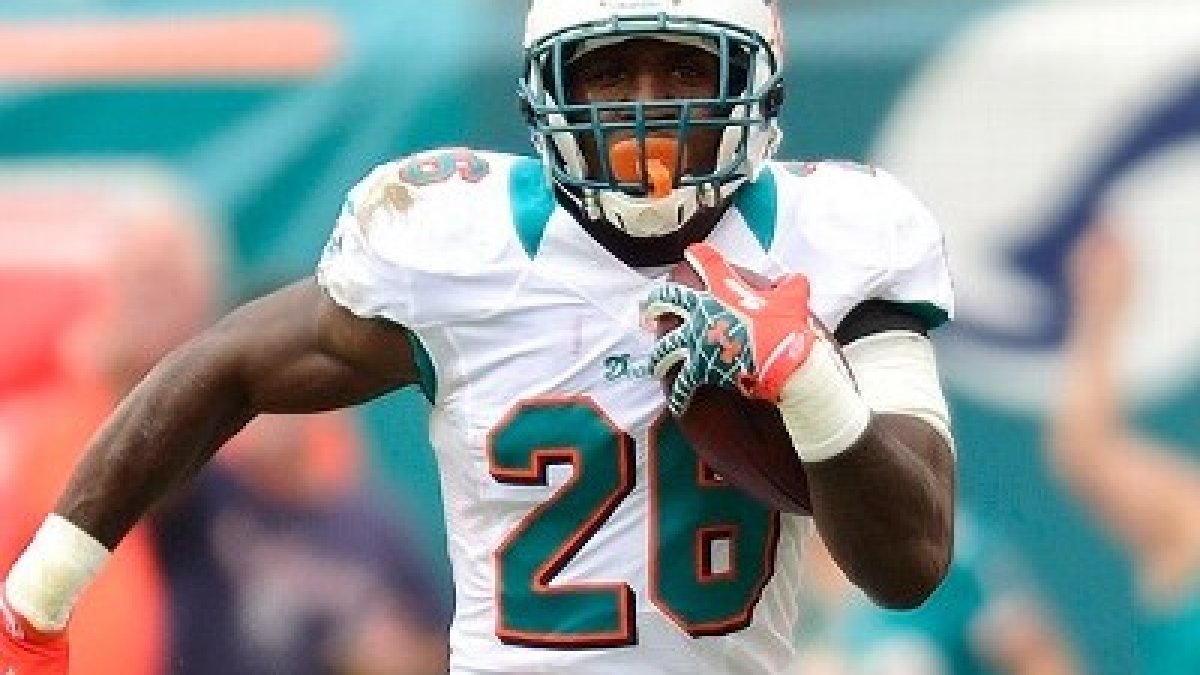
The Dolphins handling of Lamar Miller has been nothing short of peculiar. He’s been limited to a situational role throughout his career, but did manage 254 touches last season. Although he obviously deserves an uptick, it’s hard to be too upset about that number. Of course, Miami has been rumored to be in the market for an impact player at the position throughout the offseason. If they do, in fact, add a Todd Gurley or Melvin Gordon on draft day, Miller’s role will be significantly reduced. That’s a mistake. At 5.8 YPC, no player was better against base defenses last season. Thanks to Miami’s ‘11’-base offense, Miller only had to carry the ball 70 times against a base defense, but he was obviously extremely effective with those tries. Miller racked up 123 carries against nickel defenses and averaged 5.2 yards per carry. Miller’s playing time remains a concern, but he’s only 24 and extremely underrated.
Bell is worth a mention considering how poorly he fared in this category last year. He averaged 3.0 YPC against Base and 4.4 YPC against Nickel as a rookie. In 2014, those marks improved to 4.9 and 4.3, respectively. Bell was arguably the league’s most-improved player from 2013 to 2014.
Next, we have the other end of the previous chart. These backs were least productive in the league last season, underperforming their expected YPC marks by the highest margins.
| Rk | Tailback | Carries | Actual | Expected | Diff |
| 45 | Ben Tate | 122 | 3.0 | 4.3 | -1.2 |
| 44 | Alfred Blue | 165 | 3.1 | 4.3 | -1.2 |
| 43 | Trent Richardson | 157 | 3.2 | 4.3 | -1.0 |
| 42 | Andre Ellington | 201 | 3.3 | 4.3 | -1.0 |
| 41 | Toby Gerhart | 100 | 3.2 | 4.2 | -1.0 |
| 40 | Andre Williams | 216 | 3.3 | 4.3 | -0.9 |
| 39 | Knile Davis | 130 | 3.3 | 4.2 | -0.9 |
| 38 | Darren McFadden | 150 | 3.4 | 4.2 | -0.8 |
| 37 | Branden Oliver | 159 | 3.7 | 4.4 | -0.7 |
| 36 | Matt Asiata | 163 | 3.5 | 4.2 | -0.7 |
| 35 | Rashad Jennings | 167 | 3.8 | 4.5 | -0.6 |
| 34 | Bishop Sankey | 152 | 3.8 | 4.4 | -0.6 |
| 33 | Matt Forte | 263 | 3.9 | 4.5 | -0.6 |
| 32 | Shane Vereen | 101 | 4.1 | 4.7 | -0.6 |
| 31 | Fred Jackson | 140 | 3.7 | 4.3 | -0.5 |
There are a ton of underwhelming backs on this list, but there are several who should jump off the page.
Alfred Blue emerged as Arian Foster’s handcuff last season, but Houston’s 2014 sixth-round pick was not very good. He finished right there with free agent Ben Tate as the least-effective back in the league. Blue averaged a league-worst 2.7 YPC vs. base defenses and 4.1 vs. Nickel. Blue has intriguing size (6’2”/222) and is only 24, but it’s fair to expect the Texans to find a new backup for Foster via the draft.
Knile Davis is just one of those guys you want to love. A third-round pick back in 2013, Davis has settled in as Jamaal Charles’ handcuff in running back-friendly Andy Reid’s offense. Davis has had his share of big plays and has 11 touchdowns in two seasons. He’s only 23 and an intimidator at 5’10”/227. At the end of the day, however, he’s just not very good. Davis averaged 3.5 YPC each of his first two seasons and he’s been terrible against base defenses. He averaged 3.4 as a rookie and 2.7 in 2014. The latter was just behind Blue for worst in the league. Davis doesn’t get much work against nickel defenses, but this study shows that it’s not much of an excuse. Kansas City needs to address this position in a draft deep with running back talent. If you can sell Davis in dynasty, now’s the time.
The converse of Bell, Andre Ellington was very good in this study last season, but terrible in 2014. Of course, his situation changed drastically. As a rookie, Ellington was a situational back and three quarters of his carries came against nickel and dime defenses. He torched those packages to the tune of 6.8 YPC. The warning signs were there, however, as he averaged just 3.6 YPC against Base. Asked to handle a more balanced diet of carries in 2014, Ellington stumbled to 2.9 YPC vs. Base (fourth worst) and 3.7 YPC against Nickel. Expect the Cardinals to add a quality early down back via the draft.
–
Next, we have the players who faced fewer than five defensive backs on the highest percentage of their 2014 carries.
| Rk | Player | Att | <5 | >4 | <4 | Base | Nickel | Dime |
| 1 | Isaiah Crowell | 147 | 88% | 12% | 0% | 88% | 12% | 1% |
| 2 | Terrance West | 171 | 86% | 14% | 1% | 85% | 13% | 1% |
| 3 | Tre Mason | 179 | 85% | 15% | 0% | 85% | 9% | 6% |
| 4 | Frank Gore | 254 | 83% | 17% | 2% | 81% | 14% | 3% |
| 5 | Toby Gerhart | 100 | 79% | 21% | 3% | 76% | 17% | 4% |
| 6 | Doug Martin | 135 | 77% | 23% | 2% | 75% | 23% | 0% |
| 7 | Justin Forsett | 274 | 77% | 23% | 2% | 75% | 20% | 3% |
| 8 | DeMarco Murray | 435 | 77% | 23% | 4% | 73% | 21% | 3% |
| 9 | LeGarrette Blount | 172 | 76% | 24% | 13% | 63% | 24% | 0% |
| 10 | Knile Davis | 130 | 75% | 25% | 1% | 75% | 23% | 2% |
| 11 | Anthony Dixon | 104 | 73% | 27% | 5% | 68% | 27% | 0% |
| 12 | Jeremy Hill | 233 | 72% | 28% | 6% | 67% | 22% | 6% |
Seriously, Kyle Shanahan? The Browns were among the league leaders in the usage of a fullback or second tight end last season. That’s hardly a surprise considering how heavily they relied on their running game. But, when you allow Jim Dray, Ray Agnew and Kiero Small to combine for 877 snaps, the defense is going to have their third linebacker on the field nearly every time. That’s bad news for team’s running game. Crowell and West combined for 318 carries last season and are the only two backs who faced a base defense (or worse) on more than 85 percent of their carries. Of Crowell’s 129 totes, 18 came against Nickel. He averaged 4.1 YPC against base defenses. West, meanwhile, averaged 4.0 YPC vs. Base. Shanahan is out in Cleveland and upgrades at wide receiver figure to allow more ‘11’ packages, which, in turn, will open up some lanes for Crowell and West.
The next chart shows the players who had the benefit of seeing nickel, dime, or quarter defenses on the highest percentage of their carries.
| Rk | Player | Att | <5 | >4 | <4 | Base | Nickel | Dime |
| 45 | Shane Vereen | 101 | 11% | 89% | 0% | 11% | 80% | 9% |
| 44 | Matt Forte | 263 | 30% | 70% | 0% | 30% | 69% | 2% |
| 43 | C.J. Anderson | 195 | 32% | 68% | 1% | 31% | 61% | 6% |
| 42 | Ronnie Hillman | 108 | 35% | 65% | 2% | 33% | 47% | 18% |
| 41 | Lamar Miller | 208 | 36% | 64% | 2% | 34% | 59% | 5% |
| 40 | Eddie Lacy | 284 | 36% | 64% | 3% | 33% | 64% | 0% |
| 39 | Rashad Jennings | 167 | 41% | 59% | 6% | 35% | 41% | 17% |
| 38 | Denard Robinson | 130 | 42% | 58% | 1% | 42% | 55% | 3% |
| 37 | Arian Foster | 255 | 44% | 56% | 2% | 42% | 47% | 9% |
| 36 | LeSean McCoy | 310 | 44% | 56% | 0% | 44% | 48% | 8% |
| 35 | Dan Herron | 123 | 47% | 53% | 2% | 45% | 35% | 18% |
| 34 | Branden Oliver | 159 | 48% | 52% | 3% | 45% | 49% | 3% |
There aren’t many surprises here. Defenses like to keep their third (or fourth) corner on the field when facing Peyton Manning (CJ Anderson, Ronnie Hillman) and Aaron Rodgers (Eddie Lacy). Shane Vereen is easily atop the list, but New England called pass on 81 percent of his snaps last season.
Considering his YPC dipped considerably, it is a surprise to see Matt Forte here. Forte struggled to a 3.5 YPC against Base (19th worst) and a 4.0 YPC against Nickel last season. That’s after 4.1 and 4.8 marks, respectively, in 2013. This explains Forte’s dip in overall YPC from 4.6 to 3.9. As we saw earlier, Forte’s YPC was over a half yard below expected. Set to turn 30 in December, his demise is inevitable. Sell high.
–
Moving right along, last year’s study showed there’s something to be said for backs who are exceptional running against base defenses. The next chart shows the backs (min. 50 carries) with the highest YPC against Base last season.
| Rk | Player | Att | YPC |
| 1 | Lamar Miller | 70 | 5.8 |
| 2 | Justin Forsett | 206 | 5.2 |
| 3 | Denard Robinson | 54 | 4.9 |
| 4 | Le'Veon Bell | 135 | 4.9 |
| 5 | DeMarco Murray | 316 | 4.9 |
| 6 | Jeremy Hill | 155 | 4.8 |
| 7 | Jerick McKinnon | 67 | 4.8 |
| 8 | Jamaal Charles | 123 | 4.7 |
| 9 | Lorenzo Taliaferro | 50 | 4.7 |
| 10 | Jonas Gray | 76 | 4.6 |
| 11 | LeGarrette Blount | 108 | 4.6 |
| 12 | Frank Gore | 206 | 4.5 |
We already discussed most of these backs, but Denard Robinson is worth a quick note. Albeit on 54 carries, Robinson averaged a healthy 4.9 YPC against base defenses last season. Oddly, he was horrible against nickel (3.4 YPC), which limited him a 4.0 overall YPC. Robinson showed flashes in his second year playing running back, but Jacksonville seems likely to add a tailback in the draft. If they don’t, Robinson will be an intriguing fantasy target.
Next up, we have the backs with the poorest 2014 production against Base defense.
| Rk | Player | Att | YPC |
| 52 | Alfred Blue | 83 | 2.7 |
| 51 | Knile Davis | 97 | 2.7 |
| 50 | Toby Gerhart | 76 | 2.8 |
| 49 | Andre Ellington | 118 | 2.9 |
| 48 | Chris D. Johnson | 77 | 3.1 |
| 47 | Ben Tate | 83 | 3.1 |
| 46 | Trent Richardson | 90 | 3.2 |
| 45 | LeSean McCoy | 135 | 3.2 |
| 44 | Branden Oliver | 72 | 3.2 |
| 43 | Chris Ivory | 105 | 3.3 |
| 42 | Arian Foster | 107 | 3.3 |
| 41 | Stevan Ridley | 74 | 3.3 |
Entering 2014, Arian Foster had been averaging 4.6 YPC against Base and 5.1 vs. Nickel during his career. He struggled a 3.3 YPC vs. Base last season, but offset that with a 5.7 mark against Nickel. Houston’s run blocking was pretty good last season, so it’s quite interesting that both Foster and Blue struggled against base defenses. Both Garrett Graham and CJ Fiedorowicz struggled in the blocking department, which may be a factor here. Don’t be surprised if Houston addresses this position next weekend.
–
So far, our focus has been on players. Our final chart splits the data by team.
| Tm | Att | <5 | >4 | <4 | Base | Nickel | Dime |
| CLV | 423 | 84% | 16% | 1% | 83% | 13% | 2% |
| BLT | 446 | 82% | 18% | 5% | 78% | 15% | 3% |
| SF | 350 | 80% | 20% | 3% | 77% | 18% | 3% |
| SL | 341 | 77% | 23% | 1% | 77% | 15% | 8% |
| DAL | 518 | 75% | 25% | 4% | 71% | 22% | 3% |
| TB | 314 | 69% | 31% | 3% | 66% | 31% | 0% |
| KC | 347 | 68% | 32% | 3% | 65% | 28% | 4% |
| CAR | 371 | 68% | 32% | 4% | 64% | 30% | 2% |
| NE | 434 | 67% | 33% | 8% | 59% | 30% | 3% |
| OAK | 294 | 66% | 34% | 7% | 59% | 26% | 7% |
| CIN | 429 | 65% | 35% | 4% | 61% | 28% | 7% |
| WAS | 323 | 62% | 38% | 2% | 60% | 27% | 10% |
| BUF | 359 | 62% | 38% | 3% | 59% | 35% | 4% |
| MIN | 336 | 61% | 39% | 5% | 57% | 36% | 3% |
| NO | 356 | 61% | 39% | 2% | 59% | 37% | 2% |
| JAX | 292 | 60% | 40% | 2% | 59% | 36% | 4% |
| ARZ | 367 | 60% | 40% | 2% | 58% | 37% | 4% |
| TEN | 301 | 59% | 41% | 4% | 55% | 34% | 7% |
| NFL Avg. | 12008 | 59% | 41% | 3% | 56% | 36% | 5% |
| IND | 394 | 58% | 42% | 4% | 54% | 32% | 10% |
| ATL | 333 | 55% | 45% | 5% | 50% | 38% | 7% |
| SEA | 467 | 54% | 46% | 4% | 50% | 38% | 8% |
| DET | 357 | 52% | 48% | 3% | 49% | 43% | 5% |
| PIT | 387 | 52% | 48% | 5% | 47% | 46% | 2% |
| NYJ | 373 | 51% | 49% | 1% | 50% | 47% | 2% |
| NYG | 419 | 51% | 49% | 4% | 47% | 40% | 9% |
| HST | 460 | 48% | 52% | 3% | 45% | 45% | 7% |
| PHI | 416 | 43% | 57% | 0% | 43% | 48% | 8% |
| SD | 351 | 42% | 58% | 2% | 40% | 52% | 5% |
| DEN | 419 | 39% | 61% | 1% | 38% | 51% | 9% |
| GB | 408 | 37% | 63% | 3% | 34% | 63% | 0% |
| MIA | 325 | 33% | 67% | 2% | 31% | 63% | 5% |
| CHI | 298 | 28% | 72% | 0% | 28% | 71% | 1% |
Murray is worth some attention considering his change in offense during the offseason. Of his 435 carries last season, a whopping 316 came against base defenses. Consider that only two other backs (Lynch, McCoy) had more than 290 total carries last season. Despite the disadvantage, Murray averaged a healthy 4.9 YPC. That was down from a league-best 5.7 in 2013, but still extremely effective. Murray averaged 4.9 YPC against five-plus defensive back sets in 2013 and 4.6 in 2014. This is important because he heads from Dallas (75 percent of carries vs. base or tougher defenses) to Philadelphia (43 percent). It’s a huge advantage for Murray and not one that has been discussed very much. Murray’s touches will drop in 2015, but you can bet his effectiveness will rank among the best in the business.
On the other end of that overhaul in Philadelphia was LeSean McCoy. McCoy benefited from a ton of nickel defenses in each of his seasons under Chip Kelly, but that’s a thing of the past now that Greg Roman is in charge in Buffalo. Frank Gore was one of the poster boys of this piece last year, as an absurd 95 percent of his carries came against four or fewer defensive backs. As shown, the 49ers team mark was at 80 percent in 2014. McCoy averaged a dismal 3.2 YPC against base defenses last season, but somewhat made up for it with a 5.2 mark against Nickel. Over his career, McCoy is averaging 4.2 YPC against Base, which is barely above average and adds some merit to the theory that he’ll struggle in Roman’s offense. If there’s a silver lining here, it’s that the Jets have actually faced a lot of Nickel on rushing plays over the past two seasons under Ryan. It’s possible that was Marty Mornhinweg’s doing. We’ll find out in 2015, but this should certainly concern McCoy owners.
Follow Mike Clay on Twitter: @MikeClayNFL
