We hear about the red zone every week during the football season. Heck, there’s even a channel named after it. But does this part of the field really provide us with the most insightful information when it comes to running back touches? Let’s examine.
Unless this is your first football rodeo, you know that the red zone refers to the area from the 20-yard line to the goal line. Including the playoffs, there were 13,863 carries in the NFL last season, of which 2,189 came in the red zone. But herein lies our first problem. We talk about the red zone as if it was just one thing, but it isn’t. All red-zone carries are not created equally.
A good way to think about the red zone is to divide it up into quarters. Here’s how the carry distribution breaks down of those 2,189 red-zone attempts last season:
| 20-15 | 511 | 23.3% |
| 15-10 | 480 | 21.9% |
| 10-5 | 478 | 21.8% |
| 5-GL | 720 | 32.9% |
There’s a fairly even distribution of carries throughout the red zone, with the most carries fittingly coming inside the 5-yard line. While it’s certainly nice to get carries inside the 20, as fantasy owners we’re looking for pay dirt. So what happens when we look at the touchdown conversion rate for each of these quarters of the red zone?
One of these things is not like the other. Last season, there were 12 rushing touchdowns scored on 511 attempts between the 20- and 15-yard lines. That percentage more than doubles when we look to carries between the 15 and 10, and more than doubles again between the 10 and 5. However, there’s a massive jump once we get inside the 5-yard line.
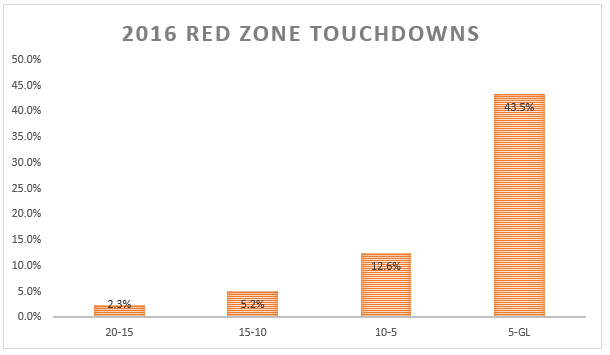
A whopping 313 touchdowns were scored inside the 5-yard line last season. That’s nearly 68 percent of all rushing touchdowns for the season. In other words, rushers are significantly more likely to score inside the 5 than in any other are of the field. And this wasn’t just last season. Here are the average touchdown conversion rates for carries inside the red zone over the last 10 years:
| 20-15 | 3.0% |
| 15-10 | 5.3% |
| 10-5 | 11.9% |
| 5-EZ | 39.3% |
This isn’t a eureka moment by any means. Common sense would easily arrive at the same conclusion. But to see it actually quantified is eye-opening.
For fantasy purposes, looking at red-zone carries really misses the boat. Our attention should really be on carries inside the 5-yard line, which is an area of the field I’m calling the “green zone.” Those in the know might remember Tom Coughlin referring to the red zone as the green zone because “green is go and red is stop.” Off of that logic, where we really see offenses “go” into the end zone on the ground is inside the 5-yard line.
The next question we need to ask is whether green-zone carries actually correlate to fantasy success? To figure this out, let’s take a look at the highest green-zone carry totals over the last 10 seasons.
Over that span, four players have topped 30 green-zone carries: Arian Foster with 34 in 2012, Adrian Peterson with 33 in 2009, LeGarrette Blount 32 in 2016, and Rashard Mendehall with 30 in 2010. Of those four, only Mendenhall did not lead the league in rushing scores, and all four finished as a top-10 fantasy options, with both Peterson and Foster ranking second in their respective seasons.
There were an additional 26 players who saw at least 20 green-zone carries. Of that group, only four players failed to score at least nine touchdowns, and only two ranked outside of the top 20 among running backs in fantasy scoring.
Based off this cursory look at the data, it’s fair to say there’s a strong correlation between green-zone carries and fantasy output. However, it’s important to note that unlike, say, forcing a missed tackle, a running back has essentially no control over how many green-zone carries he’ll receive. There are complex dynamics at play that include game flow and script, play-calling tendencies, and others. These will need to be examined in greater detail at a later date.
For now, what we can conclude is that: 1) Players are significantly more likely to score from inside the 5-yard line than in any other area of the red zone, and 2) The players who see the most carries from inside the 5 are likely to be among the top fantasy scorers for the season.
To further flesh out the second conclusion, here’s the top 10 green-zone carries along with fantasy finish for 2016:
| Player | GZ | Finish |
| LeGarrette Blount | 32 | 7th |
| David Johnson | 25 | 1st |
| Devonta Freeman | 22 | 6th |
| Matt Asiata | 20 | 34th |
| Melvin Gordon | 20 | 8th |
| Latavius Murray | 18 | 13th |
| Ryan Mathews | 17 | 25th |
| Jeremy Hill | 16 | 20th |
| Jonathan Stewart | 16 | 22nd |
| DeMarco Murray | 15 | 5th |
Seven of these players finished in the top 20 in fantasy scoring, with five ranking in the top five. Matt Asiata is the biggest outlier of the bunch, but his is a particularly unique situation. With Adrian Peterson out for most of the season, the Vikings relied on the two-headed backfield of Asiata and Jerick McKinnon. Asiata was the preferred goal-line back of this duo, with a whopping 16.5 percent of his carries coming in the green zone. By comparison, McKinnon only had three of his 159 carries inside the 5.
Like Asiata, Mathews didn’t top 200 carries for the season. However, he was used heavily in the green zone, with 11 percent of his carries coming inside the 5. In fact, among running backs with at least 100 carries, Mathews and Asiata are the only two to receive greater than 10 percent of their carries inside the five.
Stewart did top 200 carries and was very effective on his green-zone carries with nine scores on 16 attempts. His lower finish was more the product of a poor yards per attempt (3.8) and minimal usage in the passing game. Of this year’s top 25 fantasy running backs, only Stewart and Blount did not catch at least 10 balls.
As the above exercise shows, green-zone carries are a pathway to fantasy success, but they aren’t the only variable in the equation. Throughout the offseason, I’ll dive deeper into this concept with the aim of deciphering how we can ultimately predict which teams will have more green-zone attempts. That coupled with player usage tendencies will ultimately give us some predictive value for future fantasy output.

