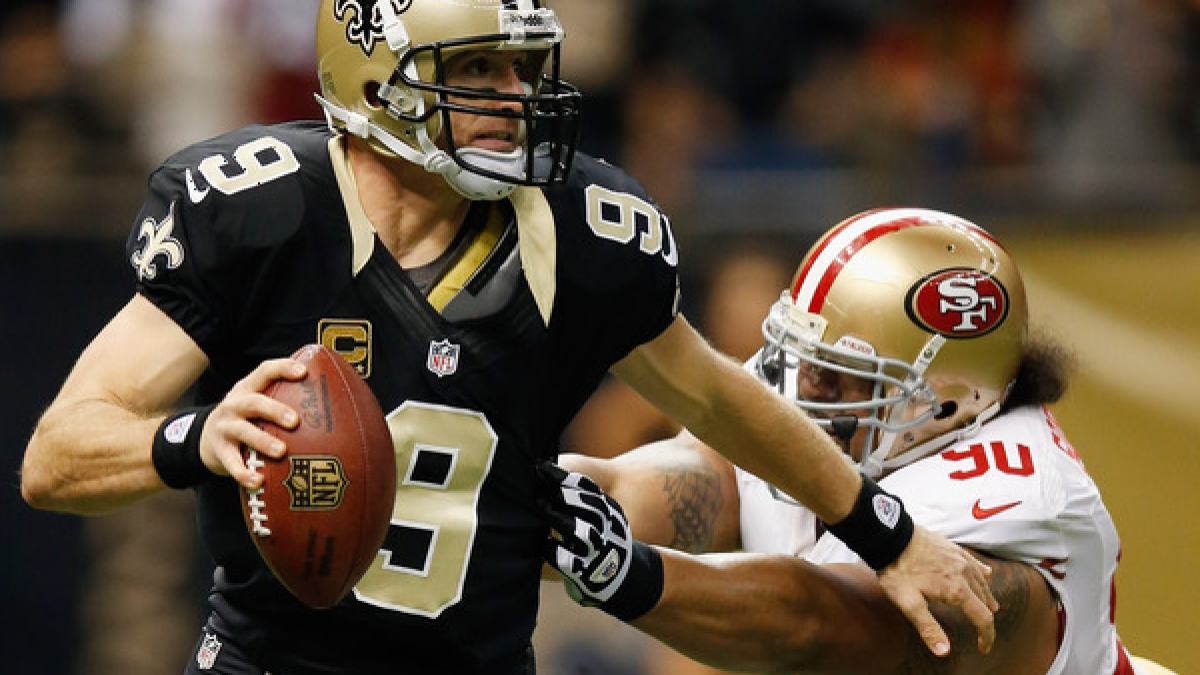
 These days, NFL fans aren’t too fond of Thursday Night Football.
The football has been sloppy and, even worse for fantasy owners, player stats are seemingly down from those compiled during Sunday games.
Today, I’m going to dive into the numbers a bit to see if players participating in TNF should be downgraded.
The sample size here will be only those Thursday games played on the short week since the start of the 2012 season. The season openers are excluded (since they’re technically not on a short week) and last year’s Thanksgiving games are included.
This leaves us with a sample size of only 19 games (compared to 286 “regular” games, which do not include playoff games). I realize this is a poor enough sample that we can’t draw strong conclusions, but we were drawing them anyways, so why not add some math to the conversation?
Overall Offense
|
Game |
G |
Plays |
TD |
Yards |
Pass% |
Fum/Gm |
|
Regular |
286 |
128.7 |
4.57 |
725.0 |
60.9% |
2.1 |
|
TNF |
19 |
130.5 |
3.89 |
723.7 |
61.7% |
1.7 |
The figures shown are NFL offensive game averages, which means the stats for both teams participating in the game are included.
The first number that really jumps off the page here is a big one: touchdowns. Offensive touchdowns are down significantly during TNF. The drop of 0.68 scores-per-game works out to just over one third of a touchdown per team. Extrapolated over the 19 TNF games, that’s a loss of about 13 total touchdowns. That’s a lot of fantasy points.
We also see a rise in passing during TNF. Teams call pass nearly one full percent more often. Fumbles, meanwhile, are down by nearly a half fumble. That one’s a bit of a surprise when you consider the sloppy play we’ve seen.
Total plays and yardage have been about the same. We see that, despite averaging nearly one full extra offensive play, teams are averaging slightly less yardage during TNF.
Passing
|
Game |
G |
TD |
INT |
TD/INT |
Com% |
YPA |
aDOT |
Sack% |
Drop% |
|
Regular |
286 |
870 |
517 |
1.7 |
65.7% |
7.6 |
8.9 |
6.4% |
6.8% |
|
TNF |
19 |
42 |
42 |
1.0 |
61.7% |
7.6 |
9.6 |
7.6% |
7.3% |
I left the raw data here for touchdowns and interceptions because of how ridiculous it is. NFL quarterbacks normally throw 1.7 touchdowns for every one interception. During TNF, it’s a pathetic 1:1 ratio. We’ve had the “luxury” of sitting through 42 touchdowns and 42 interceptions during TNF over the last year-plus. Ouch.
Scanning over the other splits, we see similar passing struggles during TNF. Passes (excluding tipped passes, throw aways, hits, spikes) are completed at a rate four percentage points lower during TNF than they are normally. A part of this can be explained by an average depth of target that is nearly a full yard higher during TNF. This also explains why our YPA (yards-per-aimed throw) is about equal.
Sacks and drops also see a rise during TNF.
Rushing
|
All Carries |
Designed Runs |
||||||
|
Game |
G |
Att |
Yds |
YPC |
Att |
Yds |
YPC |
|
Regular |
286 |
15444 |
65181 |
4.22 |
14094 |
59460 |
4.22 |
|
TNF |
19 |
1024 |
4259 |
4.16 |
925 |
4002 |
4.33 |
A look at 15,444 carries shows us a 4.22 NFL-wide Yards-Per-Carry (YPC) mark on rush attempts over the last year or so. We see that mark drops to 4.16 during TNF.
Of course, I’m all about removing plays that may distort the numbers. If we eliminate kneels, sneaks, and scrambles, we’re left with ‘designed runs’.
Interestingly, YPC on designed runs is actually higher during TNF than it is normally. A little extra digging shows that regular games generally see about 2.8 scrambles-per-game, whereas TNF games have been at 2.5. Had there been a little bit more Michael Vick or Cam Newton running wild during TNF, the overall YPC would be larger.
Regardless, it’s certainly interesting that teams tend to have more success running the ball during TNF than they do normally. Considering that most designed runs are by tailbacks, this is worth noting when setting your weekly roster.
Follow Mike Clay on Twitter: @MikeClayNFL


 © 2024 PFF - all rights reserved.