All News & Analysis
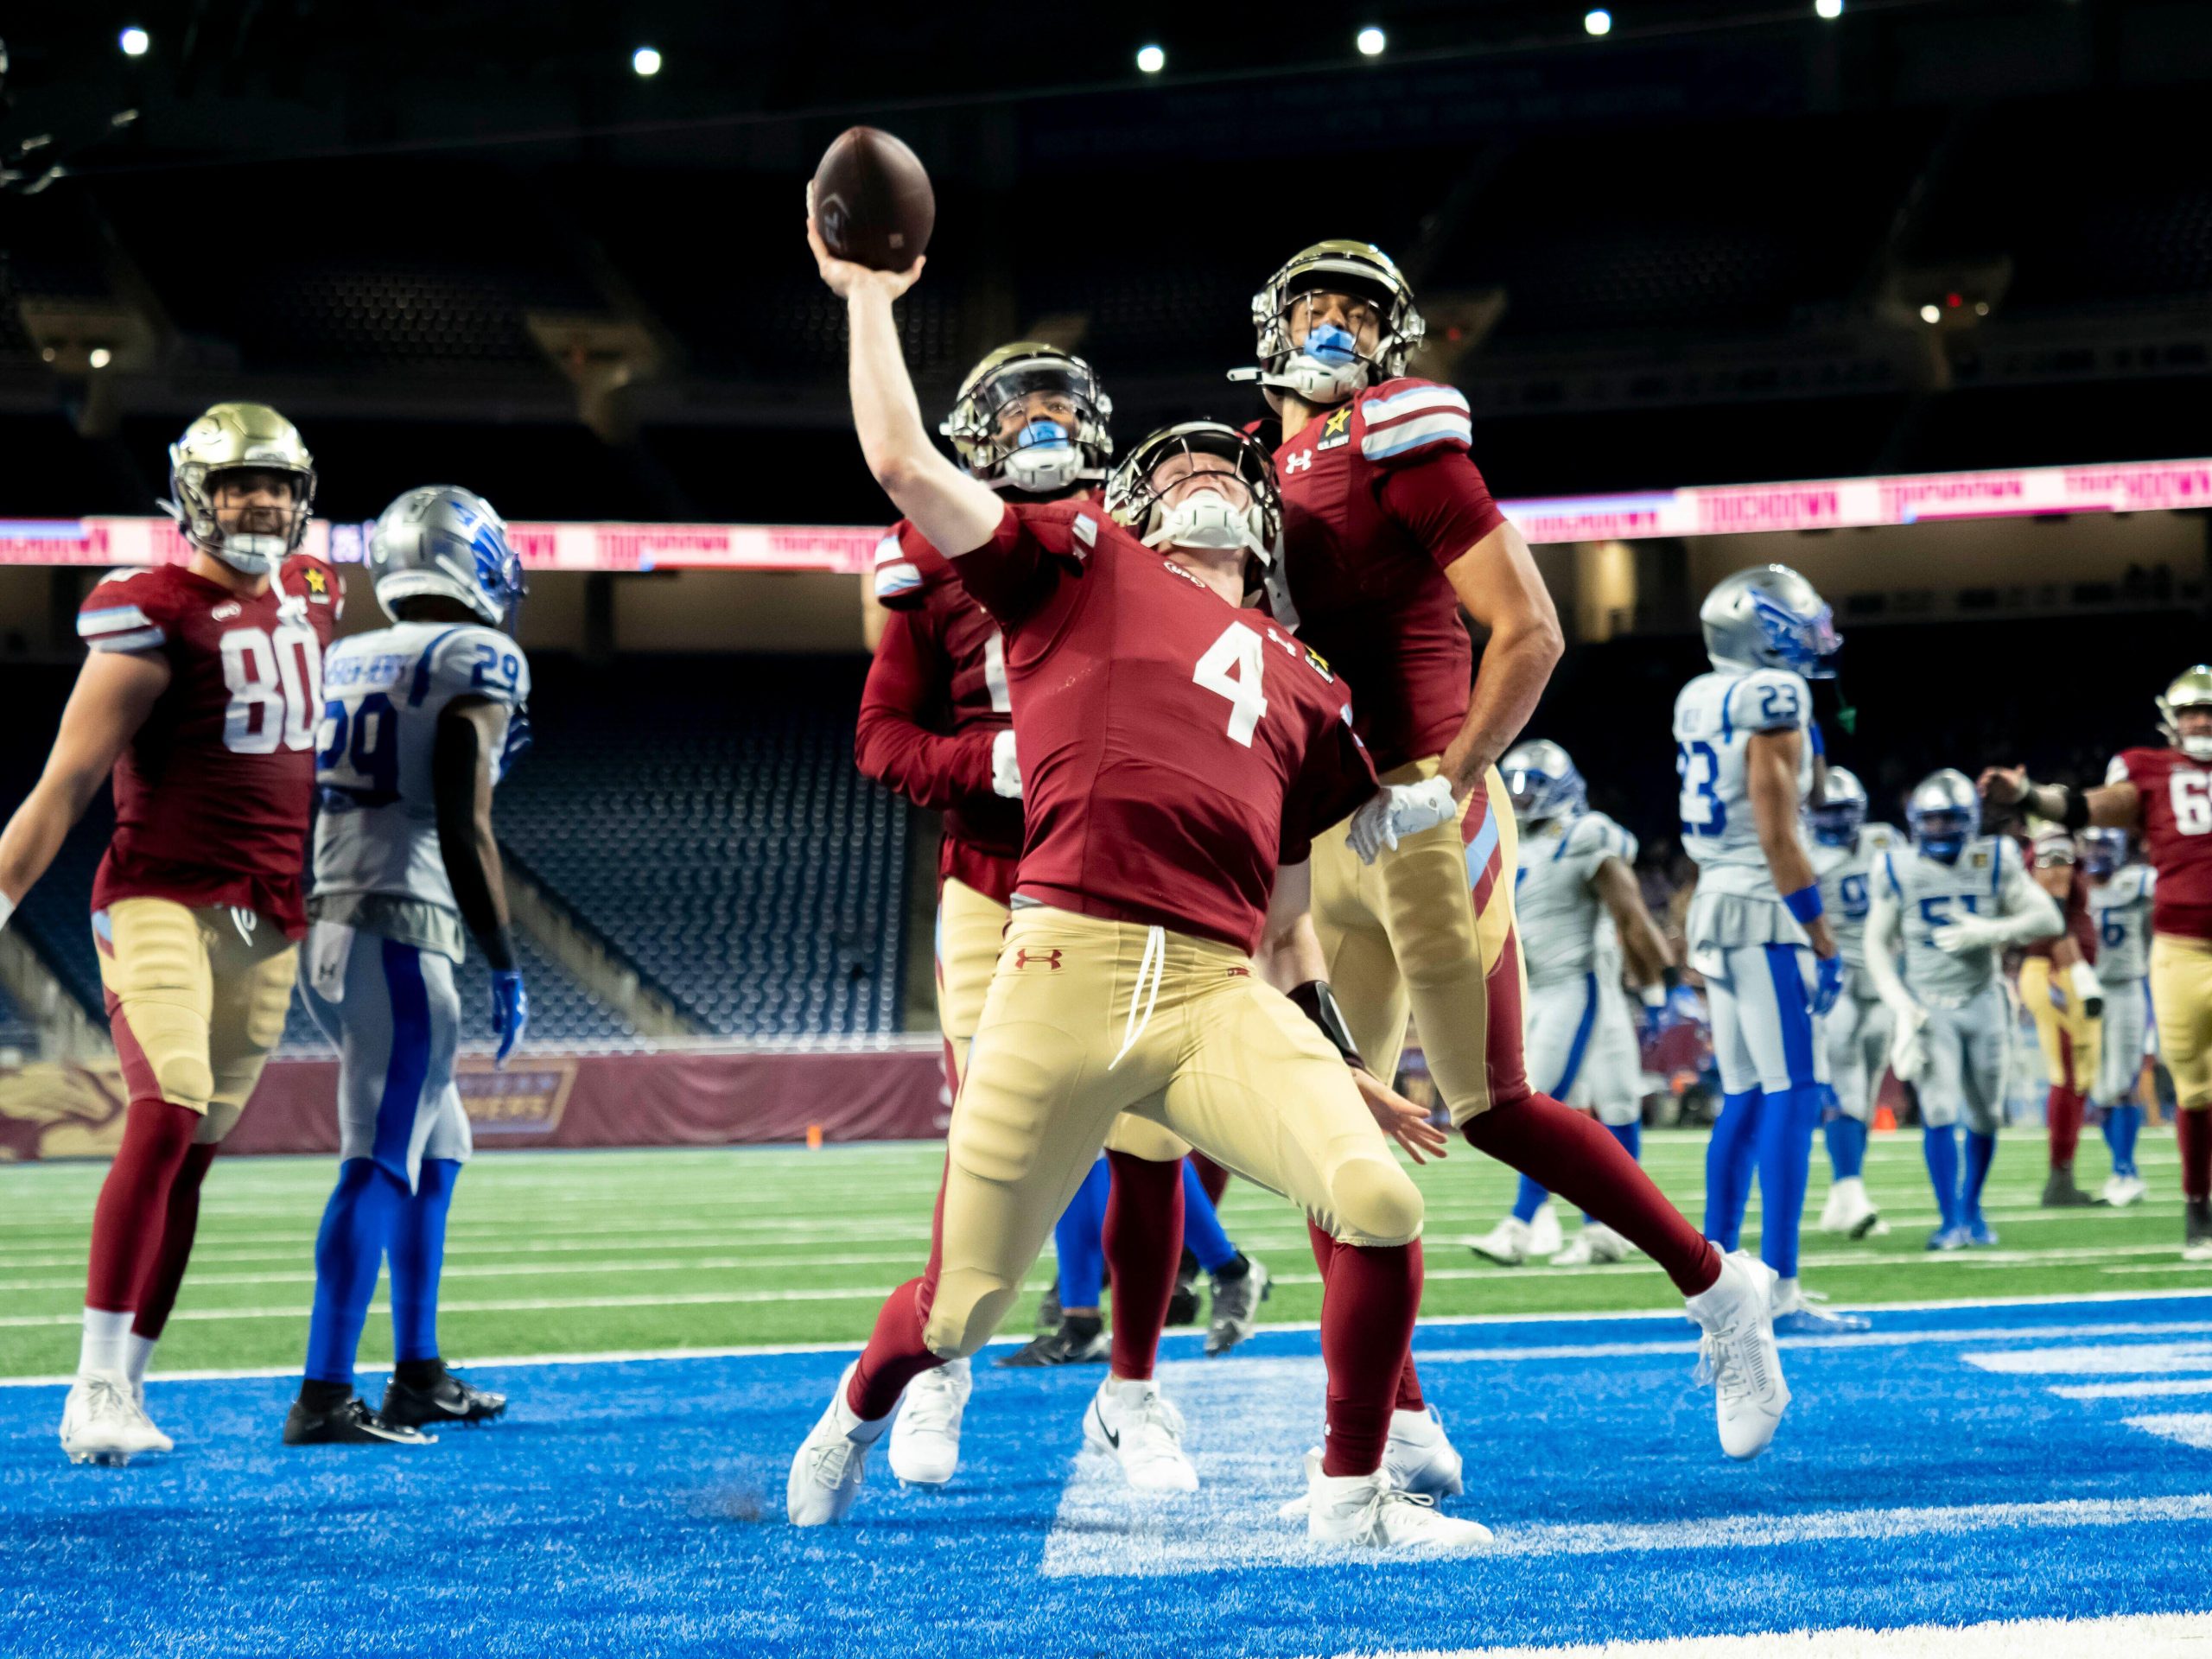
Michigan Panthers quarterback EJ Perry and Birmingham Stallions edge defender Jonathan Garvin headline PFF's UFL Week 3 Team of the Week.
Tue, 16 Apr 24 12:00:38 +0000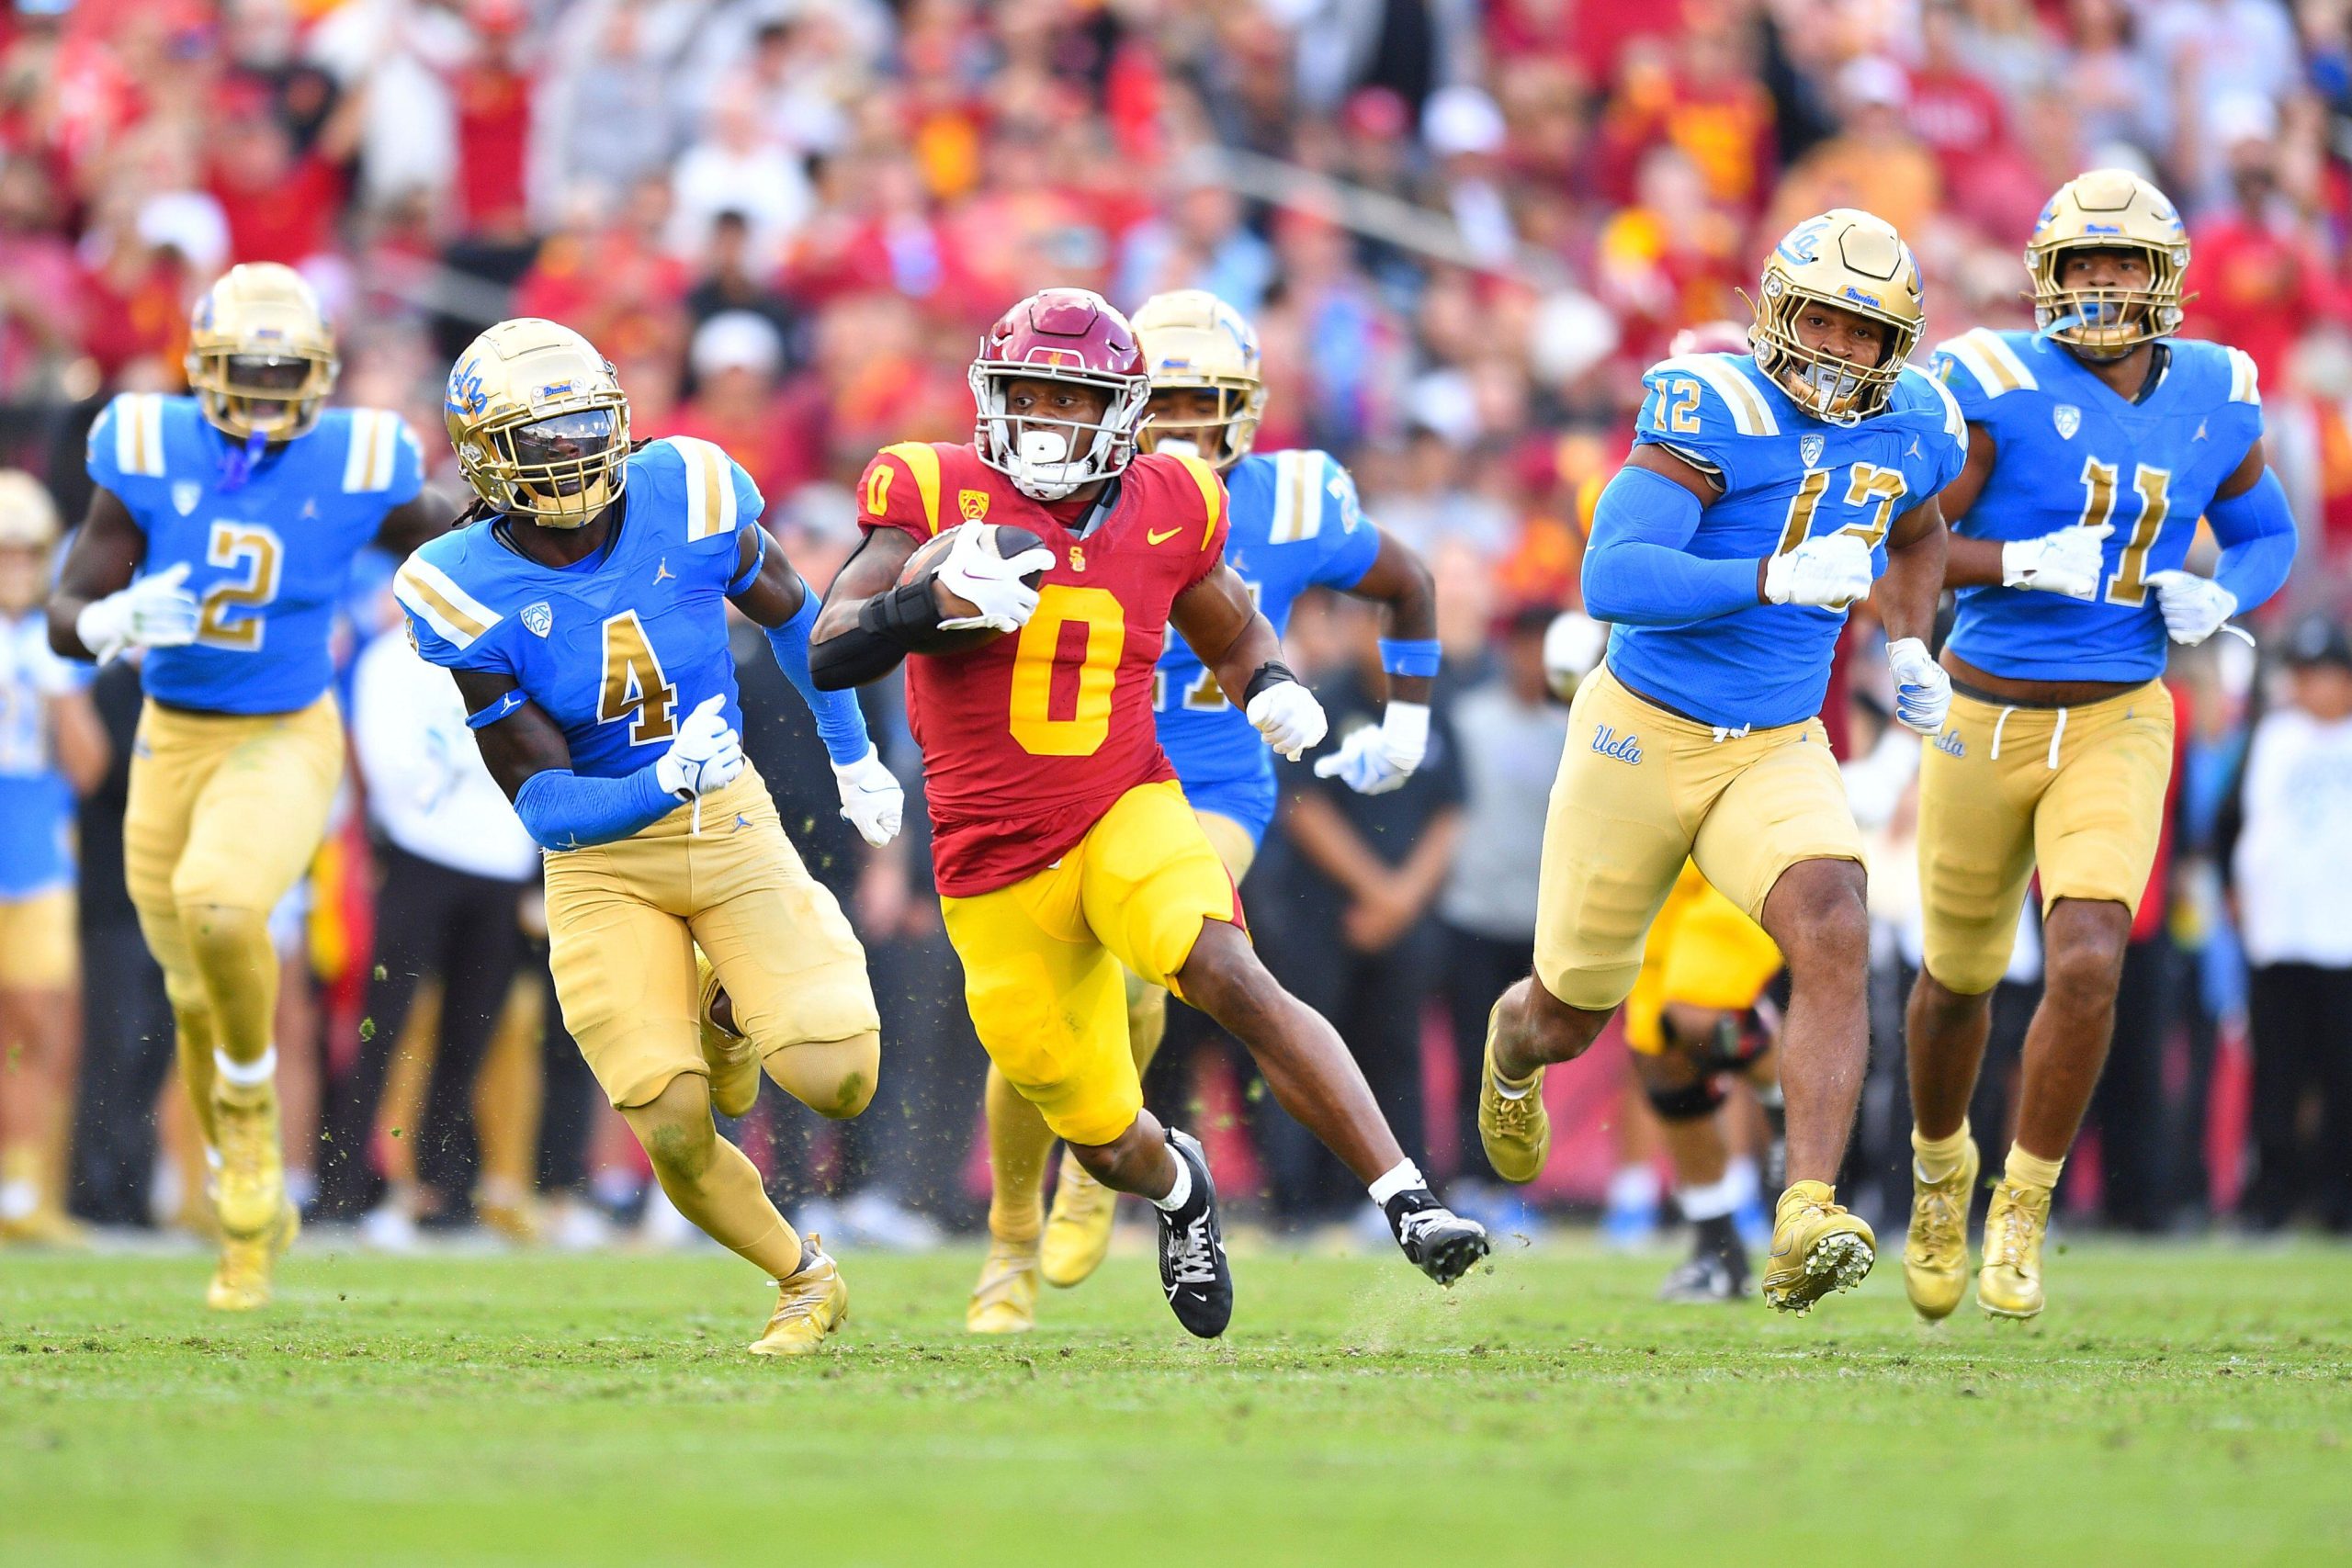
Elusiveness is a key trait for running backs, and NFL teams will be targeting 2024 NFL Draft prospects who excel in that facet.
Tue, 16 Apr 24 11:30:57 +0000
Sam Monson reveals the most underrated prospect in the 2024 NFL Draft.
Tue, 16 Apr 24 11:15:20 +0000
Trevor Sikkema reveals his seven-round Dallas Cowboys mock draft.
Tue, 16 Apr 24 11:00:36 +0000
Jon Macri reveals his running back rankings for the 2024 NFL Draft with a fantasy football slant.
Tue, 16 Apr 24 10:45:41 +0000
Jenkins is one of the strongest players in the entire draft class, but his arm-length limitations and lack of pass-rush profile will likely limit him to a mid-to-late Day 2 selection.
Tue, 16 Apr 24 10:00:03 +0000
Orhorhoro is a versatile defensive lineman who can be a high-floor player at defensive end or defensive tackle.
Tue, 16 Apr 24 09:45:27 +0000
Fiske's measurements are not ideal, but he has an NFL-level football IQ and pass-rush quickness to be a potential impact player.
Tue, 16 Apr 24 09:30:13 +0000
The 6-foot-1, 305-pounder brings elite-level strength and athletic ability to trench play and notably earned a spot on Bruce Feldman's 2023 “Freaks List."
Tue, 16 Apr 24 09:15:11 +0000
Newton has some physical limitations due to his size and lack of natural flexibility, but his hand usage, pass-rush tools and block-shedding ability allow him to be very productive in any alignment as a three-to-five-technique player.
Tue, 16 Apr 24 09:00:59 +0000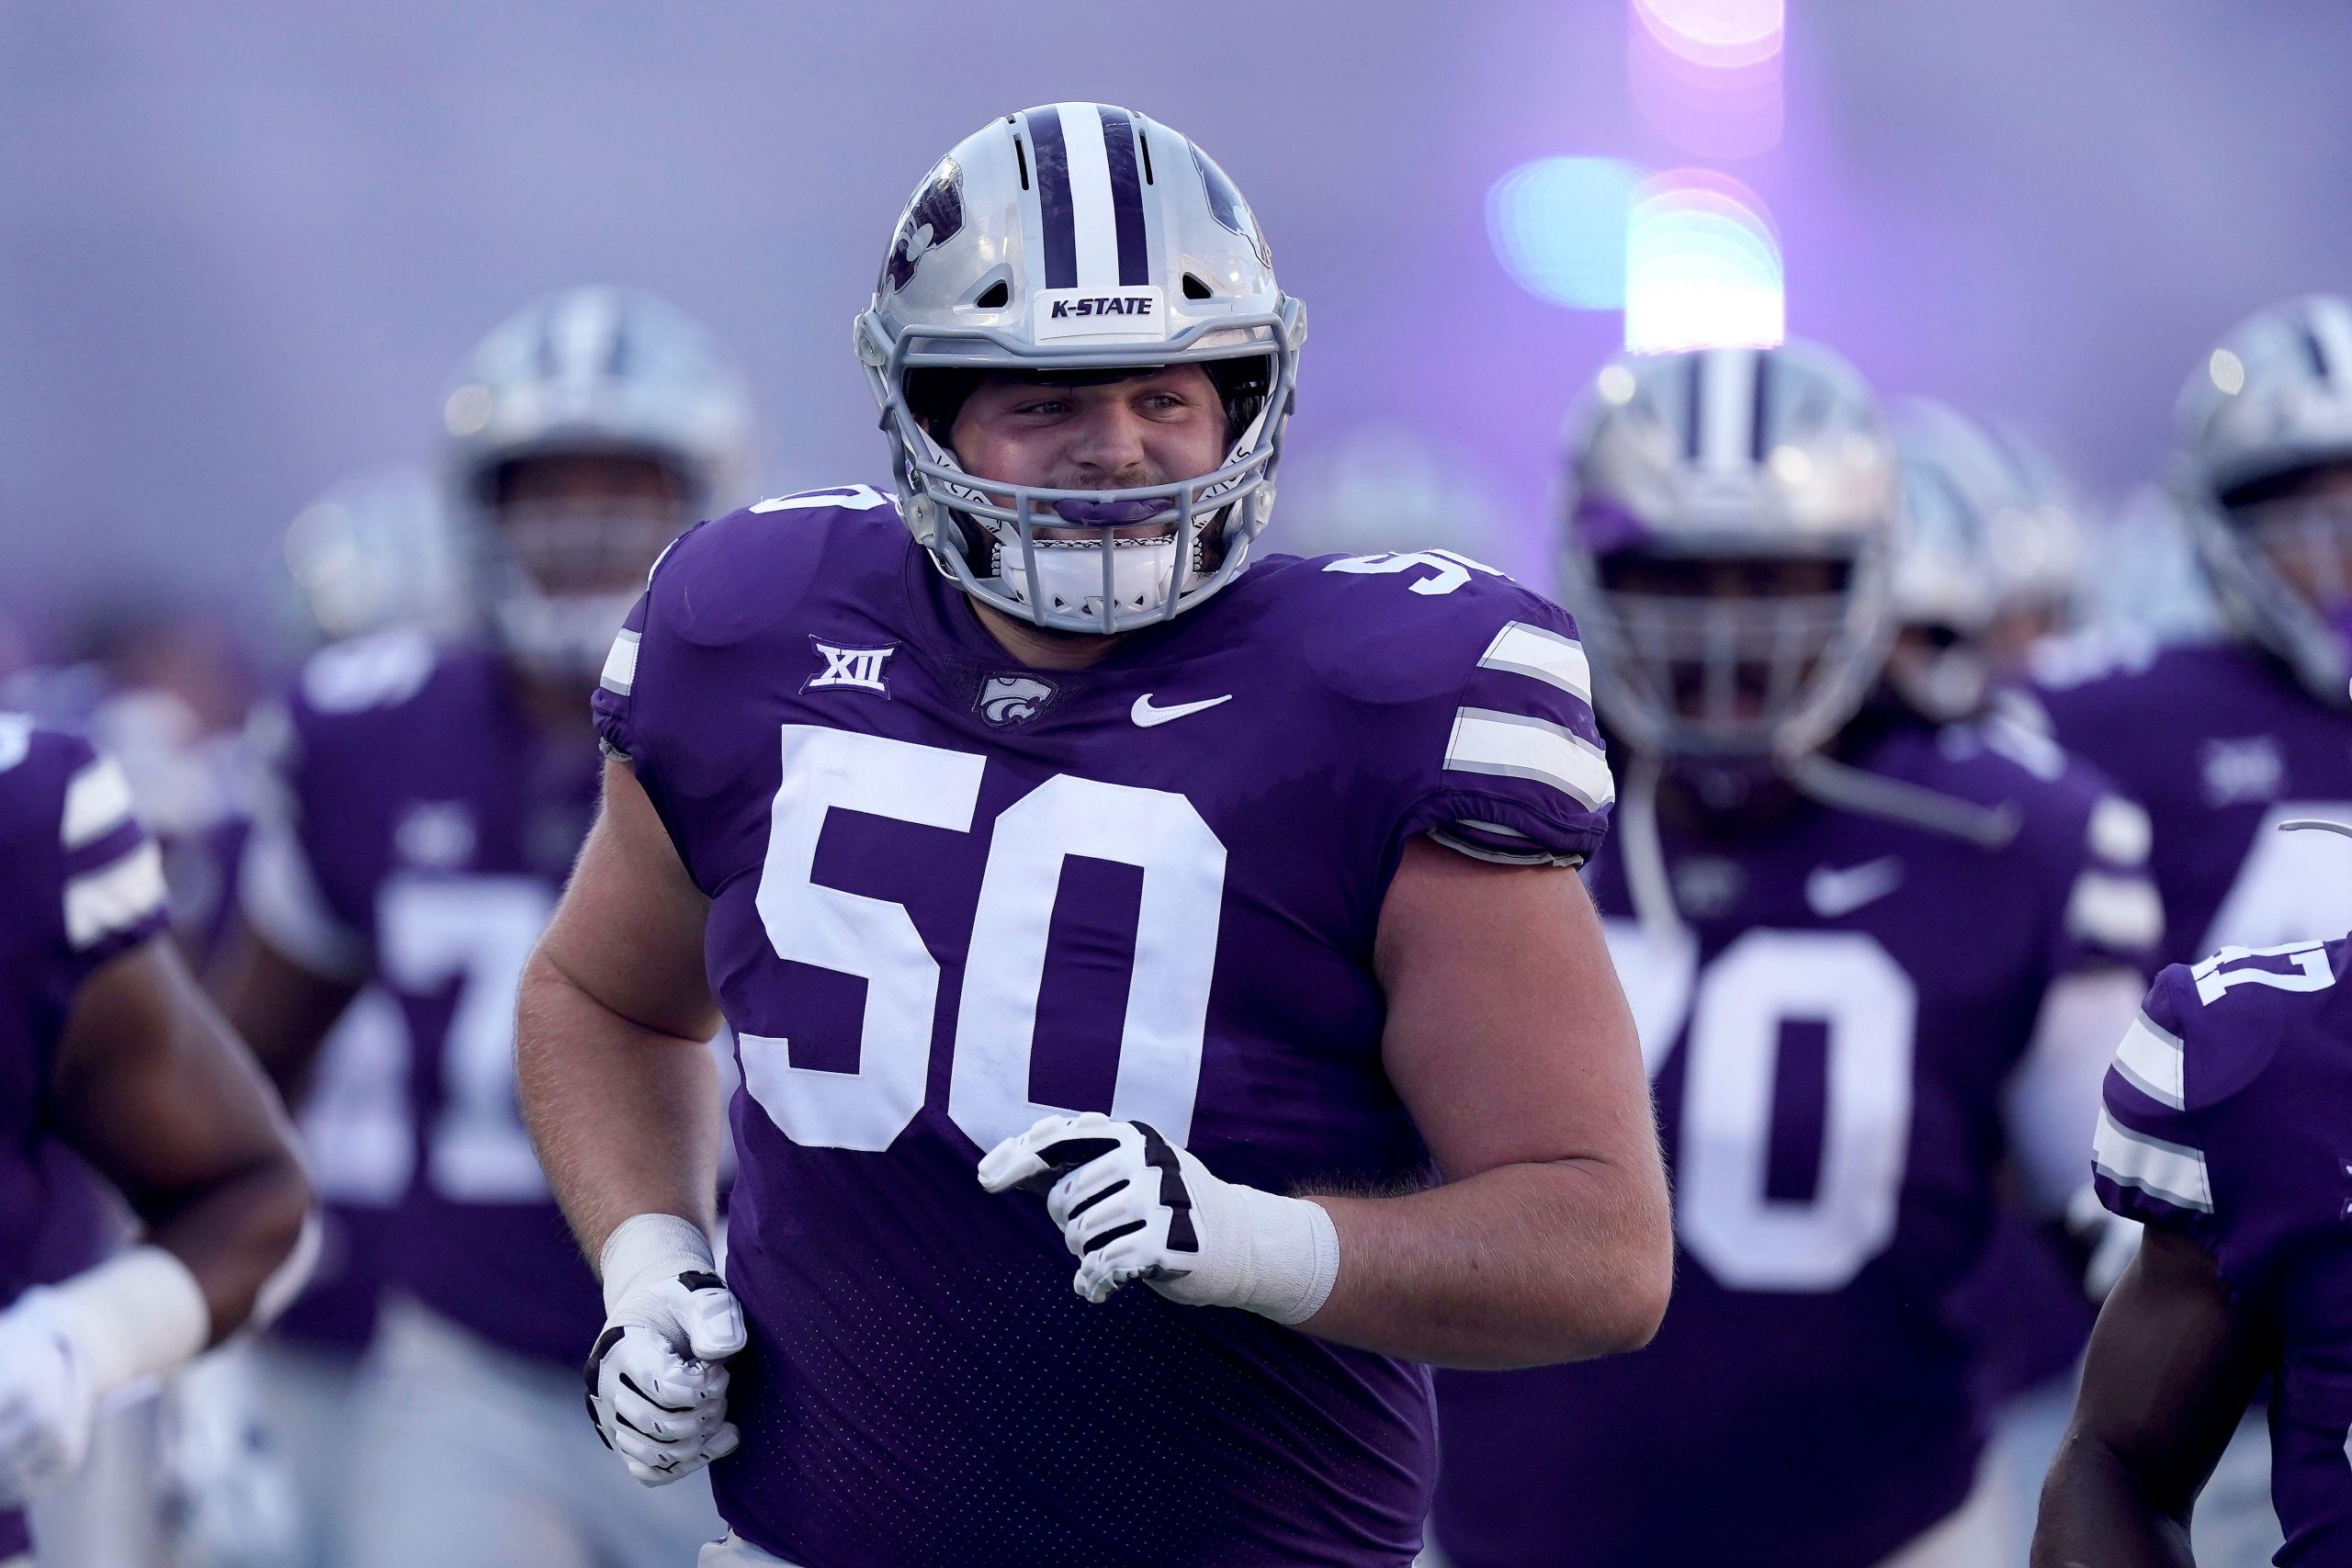
Kansas State's Cooper Beebe earned class-leading grades in a variety of high-leverage and stable facets of play.
Mon, 15 Apr 24 11:00:09 +0000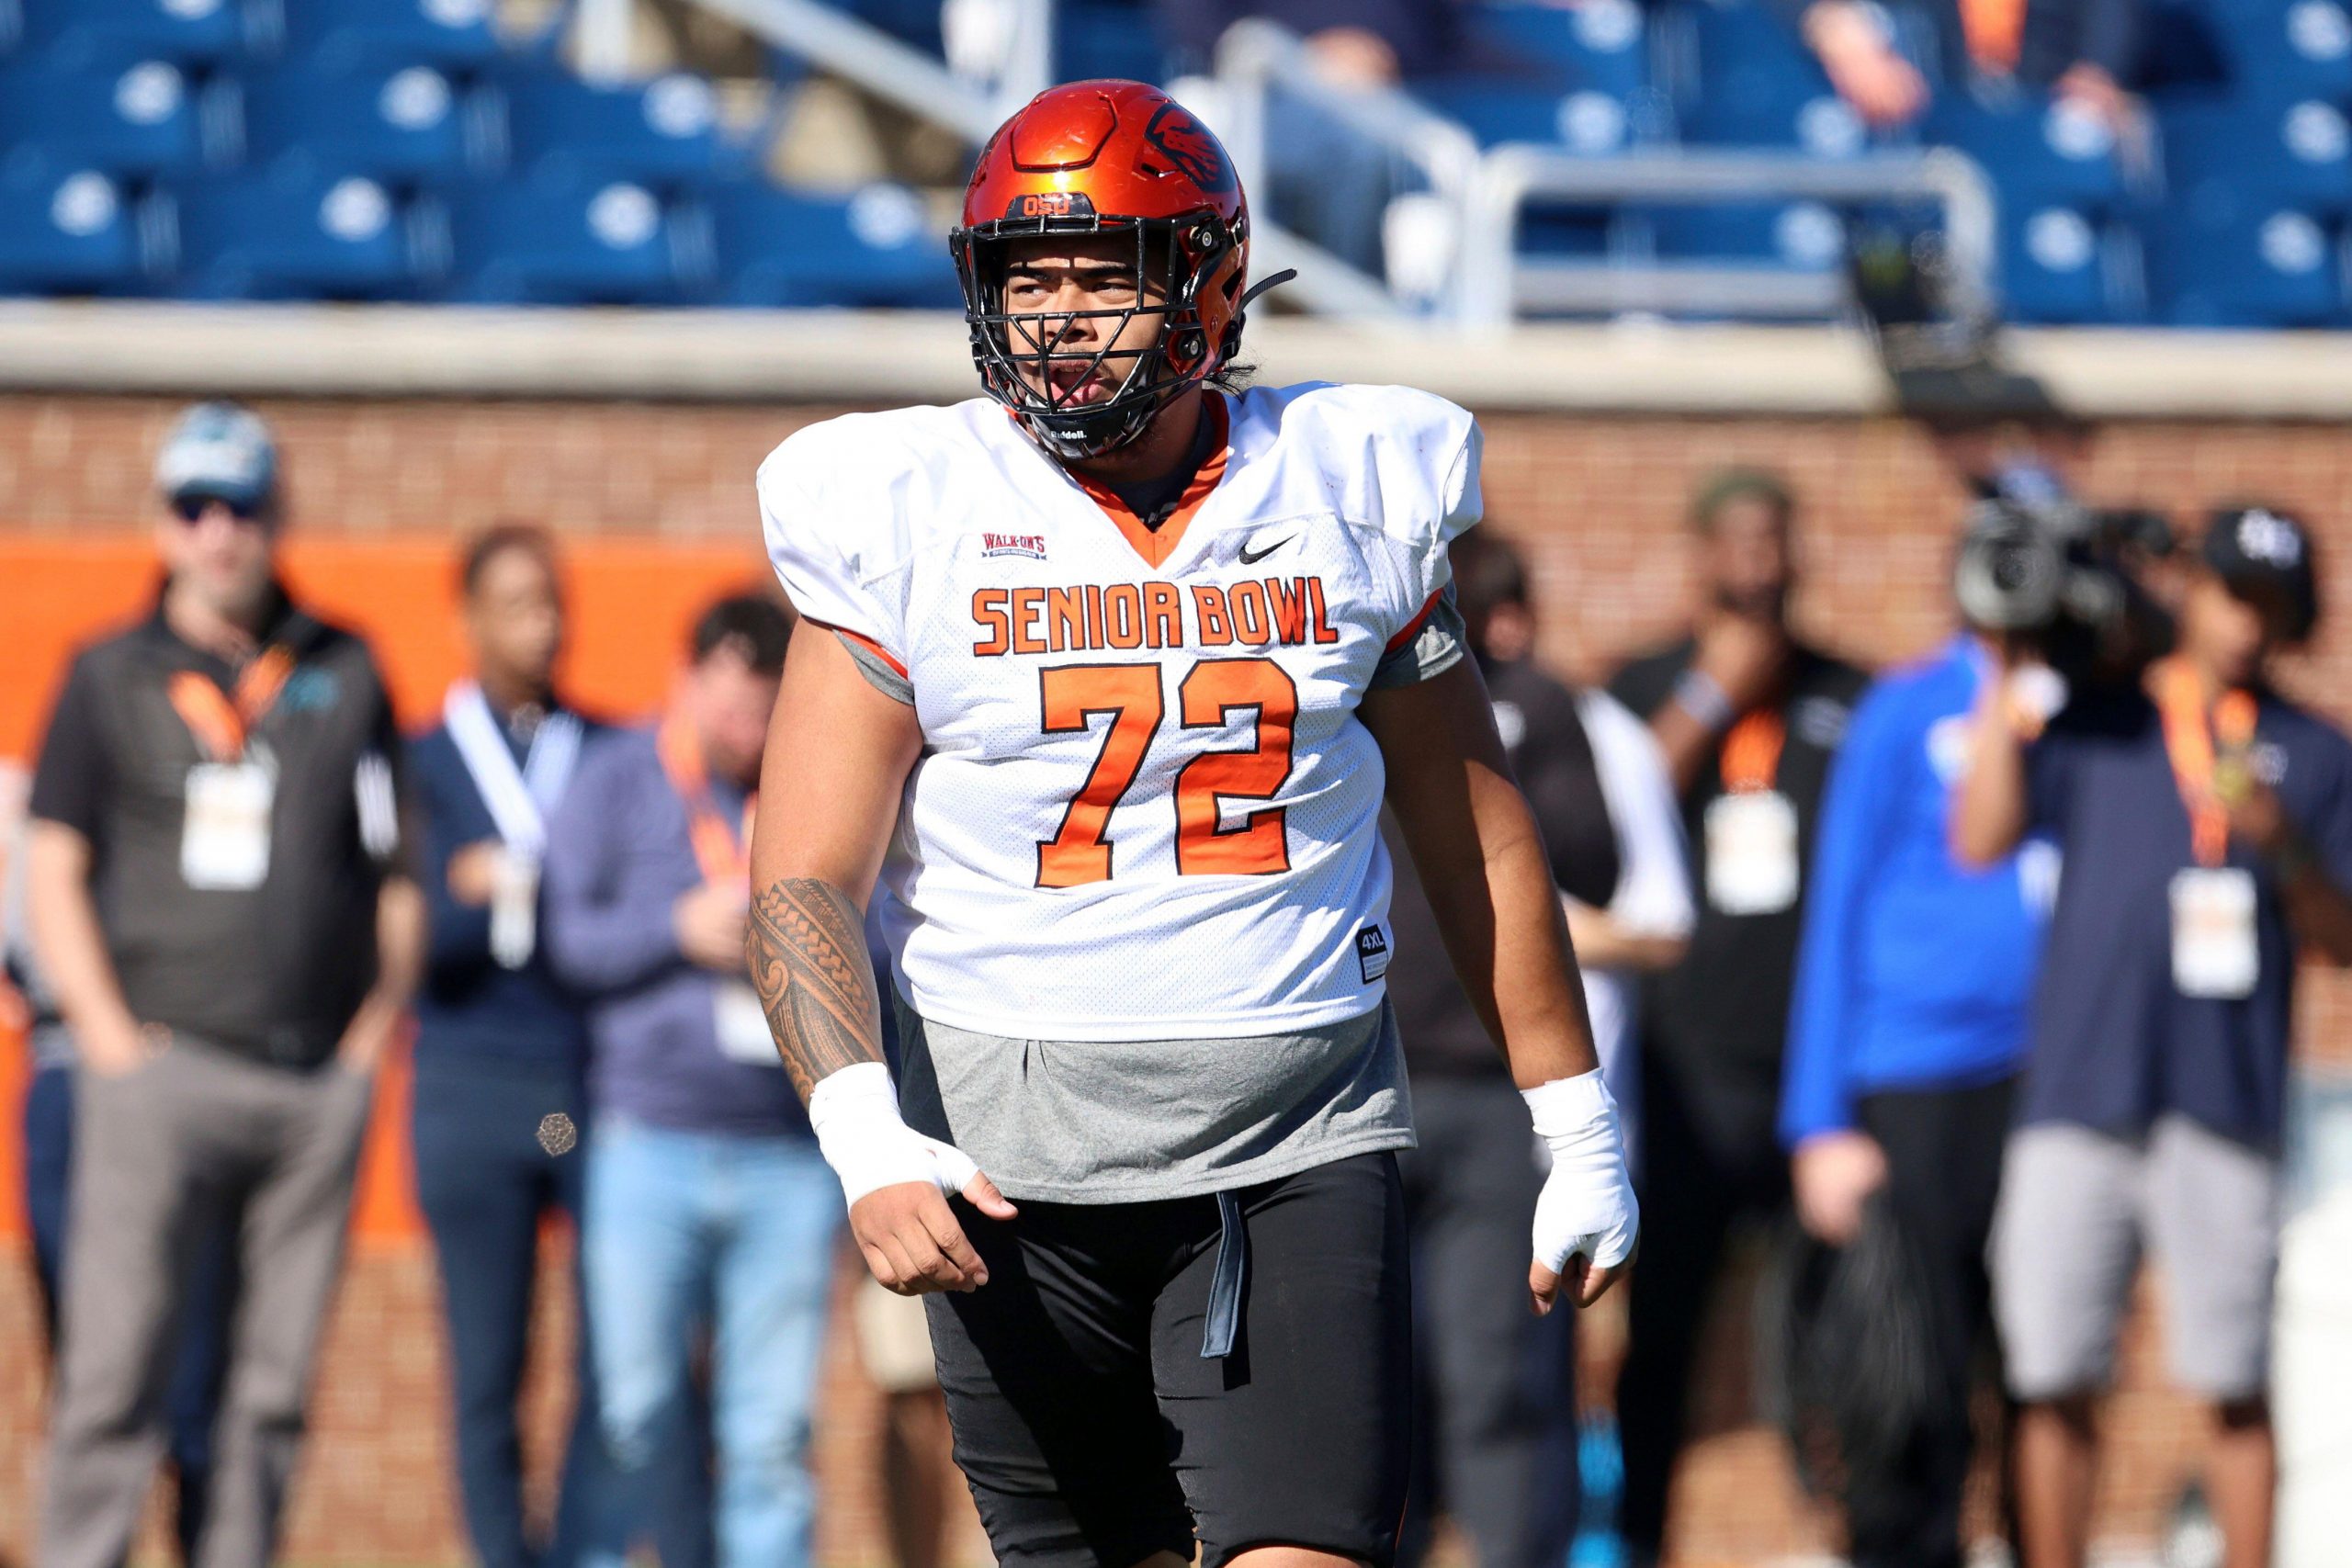
Mason Cameron details the highest-graded OTs from the 2024 NFL Draft in every category.
Mon, 15 Apr 24 10:45:51 +0000
Regardless of his lack of polish, Robinson is a gifted athlete — likely on a level that is top of the class. A lot of what leaves you wanting more from Robinson is coachable. Unlocking that is the key for him to go from a boom-or-bust athlete to a dominant edge defender.
Mon, 15 Apr 24 10:30:14 +0000
Even if he doesn't become a pass-rush technician, Braswell's power, speed and length give him the floor of a rotational pass-rusher and the ceiling of an impact starter.
Mon, 15 Apr 24 10:15:16 +0000
The Commanders take J.J. McCarthy at No. 2 and the Vikings grab two quarterbacks in this two-round 2024 NFL mock draft.
Mon, 15 Apr 24 10:00:36 +0000

Max Chadwick reveals the top-10 CB prospects in the 2024 NFL Draft if everyone in college football was eligible.
Mon, 15 Apr 24 09:00:22 +0000
PFF lead draft analyst Trevor Sikkema ranks the 2024 prospects at every position.
Mon, 15 Apr 24 08:55:12 +0000
The 2024 NFL Draft big board, which has USC quarterback Caleb Williams at No. 1 and Ohio State wide receiver Marvin Harrison Jr. at No. 2.
Mon, 15 Apr 24 08:45:30 +0000
USC's Caleb Williams headlines PFF's 2024 NFL Draft quarterback rankings.
Mon, 15 Apr 24 08:40:08 +0000All Featured Tools
-
Our exclusive database, featuring the most in-depth collection of NFL player performance data.
Available with
PFF All News & Analysis
The latest football news, analysis, and rankings from PFF. Featuring data-driven rankings and stats for NFL, fantasy football, and the NFL Draft.
