All News & Analysis

PFF’s 2024 NFL Draft Show will be streamed on Fubo Sports — the live, free-to-consumer TV network from FuboTV Inc.
Thu, 18 Apr 24 16:59:43 +0000
Before these prospects find their new homes on draft night, let’s take a look at the 2024 rookie wide receiver class by highlighting the best wide receivers against man coverage, zone coverage, who dominated against both and more.
Thu, 18 Apr 24 16:15:36 +0000
In recent years, players like Russell Wilson, Kirk Cousins and Brock Purdy have emerged from that group of sleepers and have enjoyed top-level success in the NFL. Here, we’ll examine the "next tier" of quarterback options in order of their potential to start at the next level.
Thu, 18 Apr 24 13:59:18 +0000
Trevor Sikkema reveals his seven-round Detroit Lions mock draft.
Thu, 18 Apr 24 12:35:25 +0000
Here’s how the top-10 quarterback prospects would shake out for the 2024 NFL Draft if everybody in college football was eligible to be selected.
Thu, 18 Apr 24 12:30:34 +0000
UCLA's Laiatu Latu headlines the top 2024 edge defender prospects for IDP fantasy football.
Thu, 18 Apr 24 12:00:28 +0000
The 2024 NFL Draft is less than two weeks away. Here are five X-factors to keep an eye on.
Thu, 18 Apr 24 11:30:19 +0000
The Philadelphia Eagles add first-round-caliber players with their first three picks in this 2024 NFL mock draft.
Thu, 18 Apr 24 11:15:16 +0000
A few teams are in great positions to recoup significant draft capital by trading back in the 2024 NFL Draft.
Thu, 18 Apr 24 10:30:28 +0000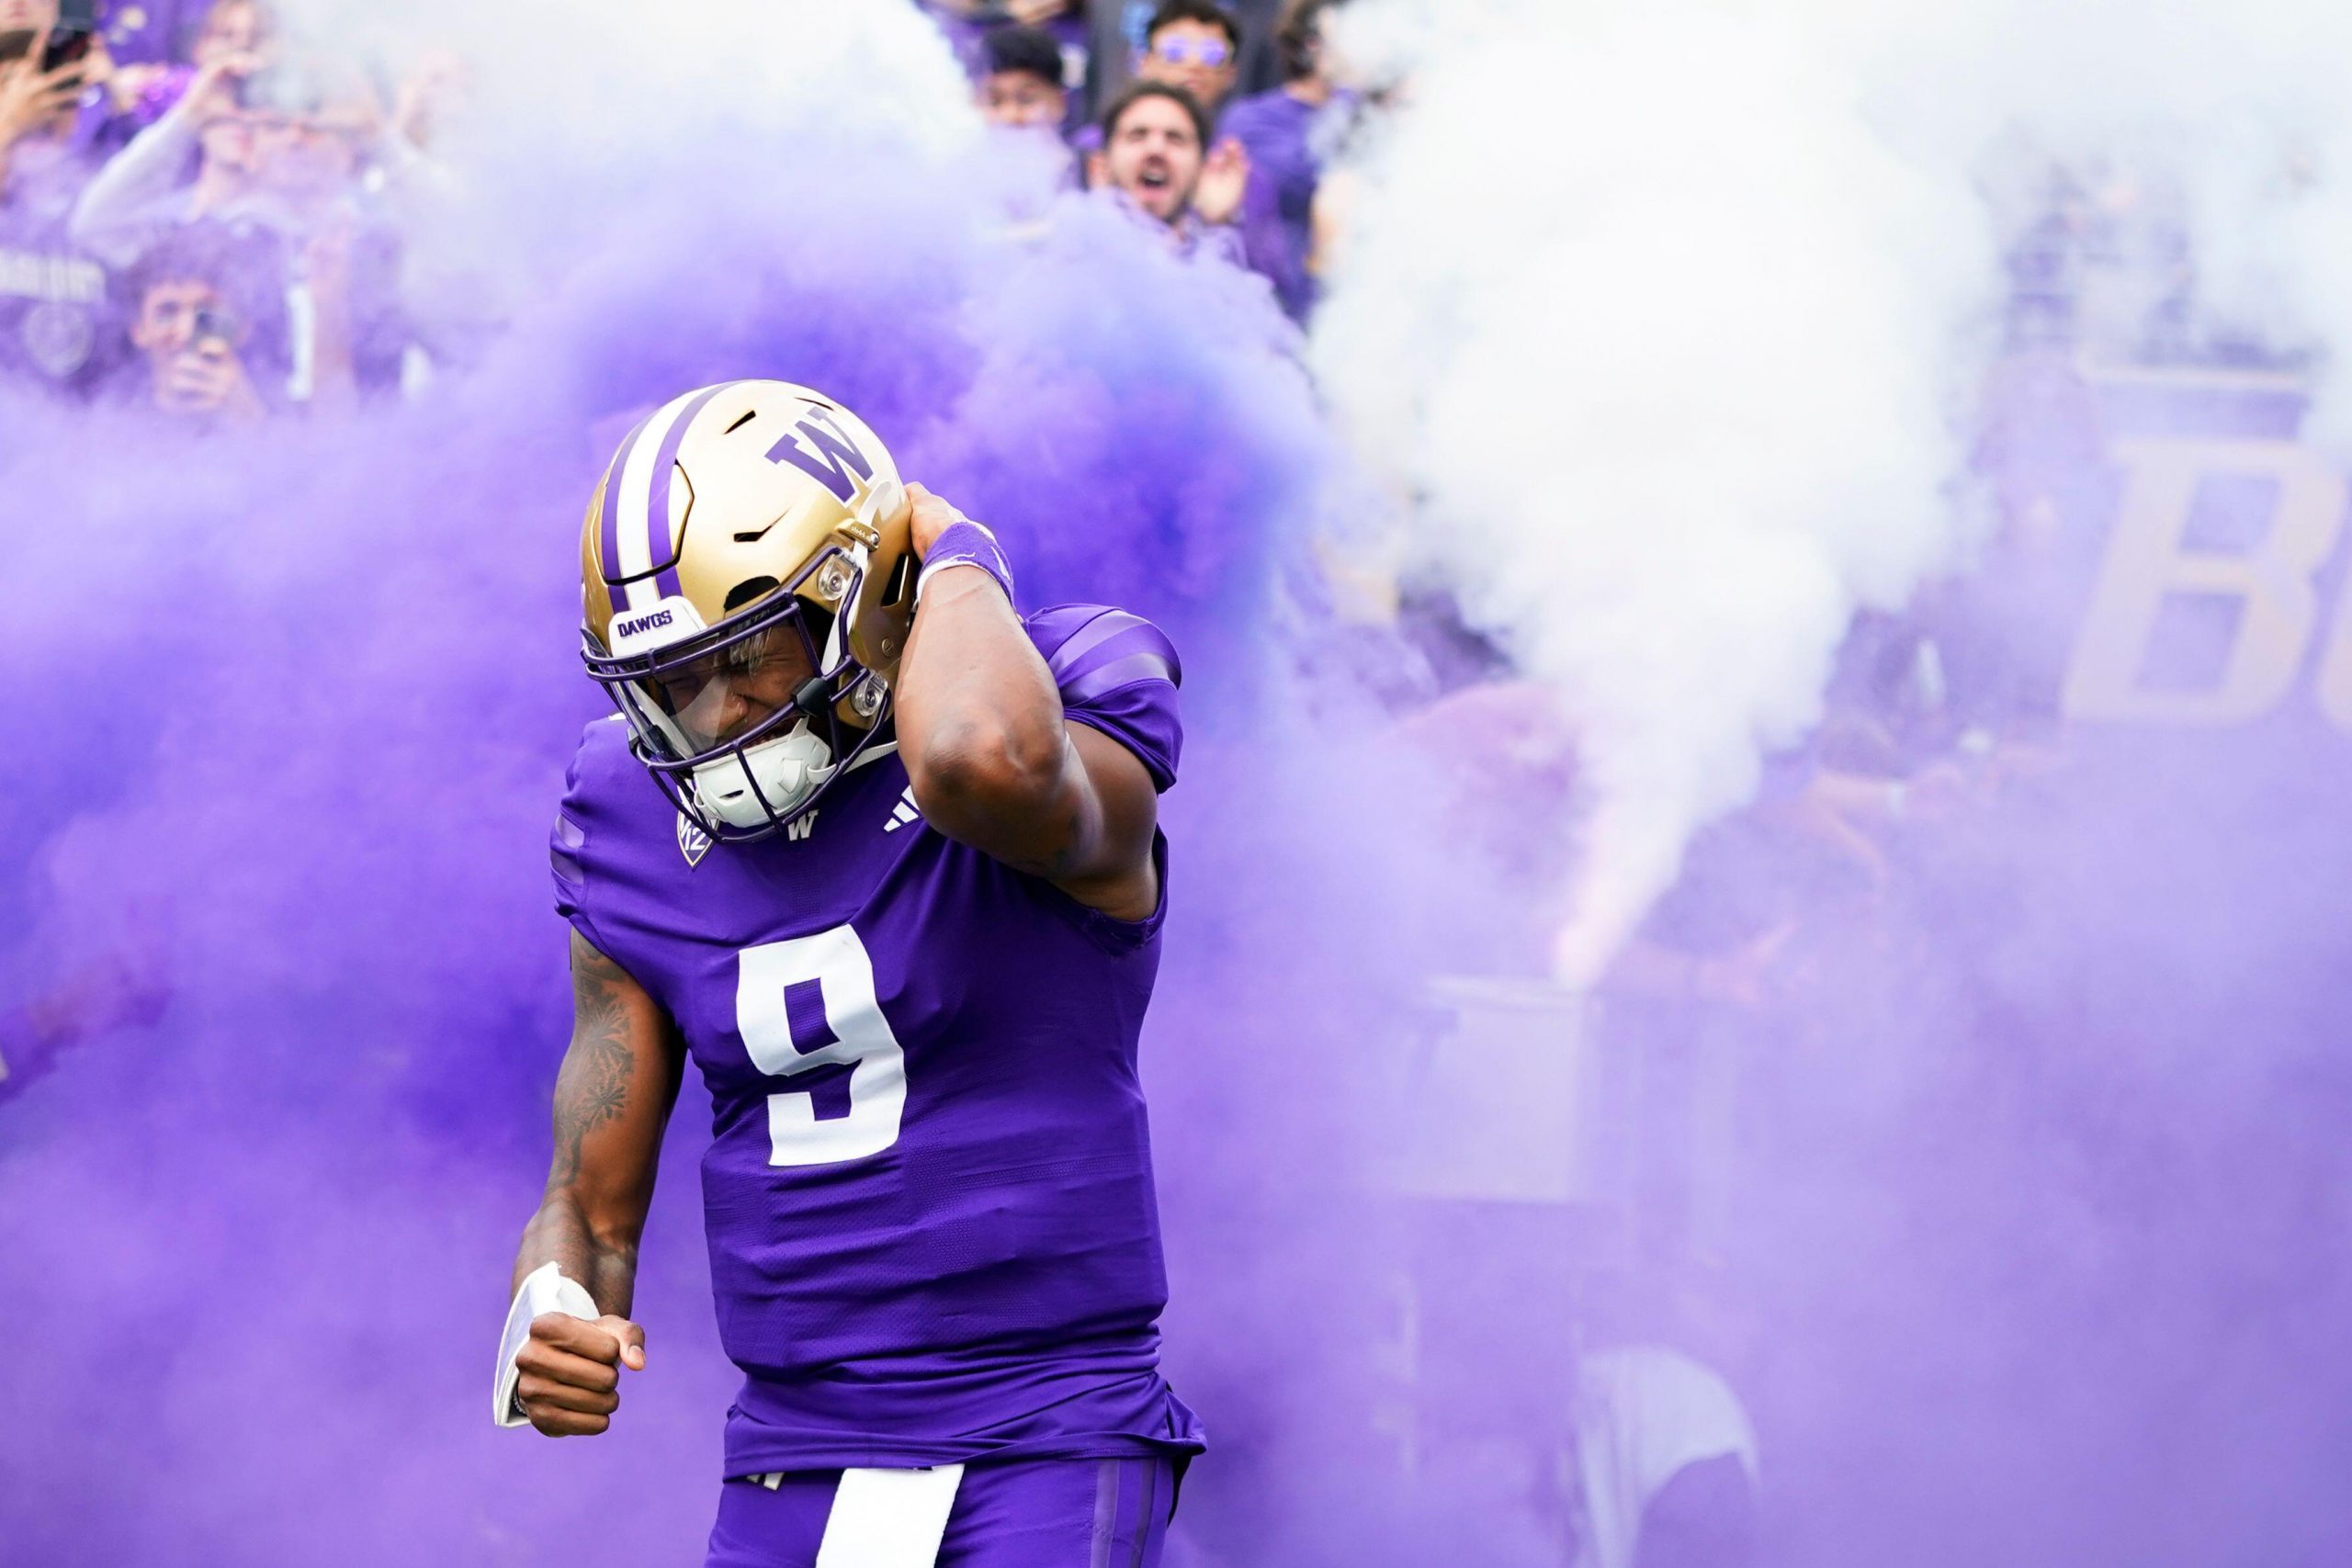
We break down Washington quarterback Michael Penix Jr.'s strengths and weaknesses in this 2024 NFL Draft scouting report.
Wed, 17 Apr 24 13:10:16 +0000
We highlight the biggest discrepancies between a player's PFF's big board rank and their average draft position in PFF's Mock Draft Simulator.
Wed, 17 Apr 24 12:30:23 +0000
The New York Giants add two offensive playmakers and solidify their defense in this seven-round 2024 NFL mock draft.
Wed, 17 Apr 24 12:00:38 +0000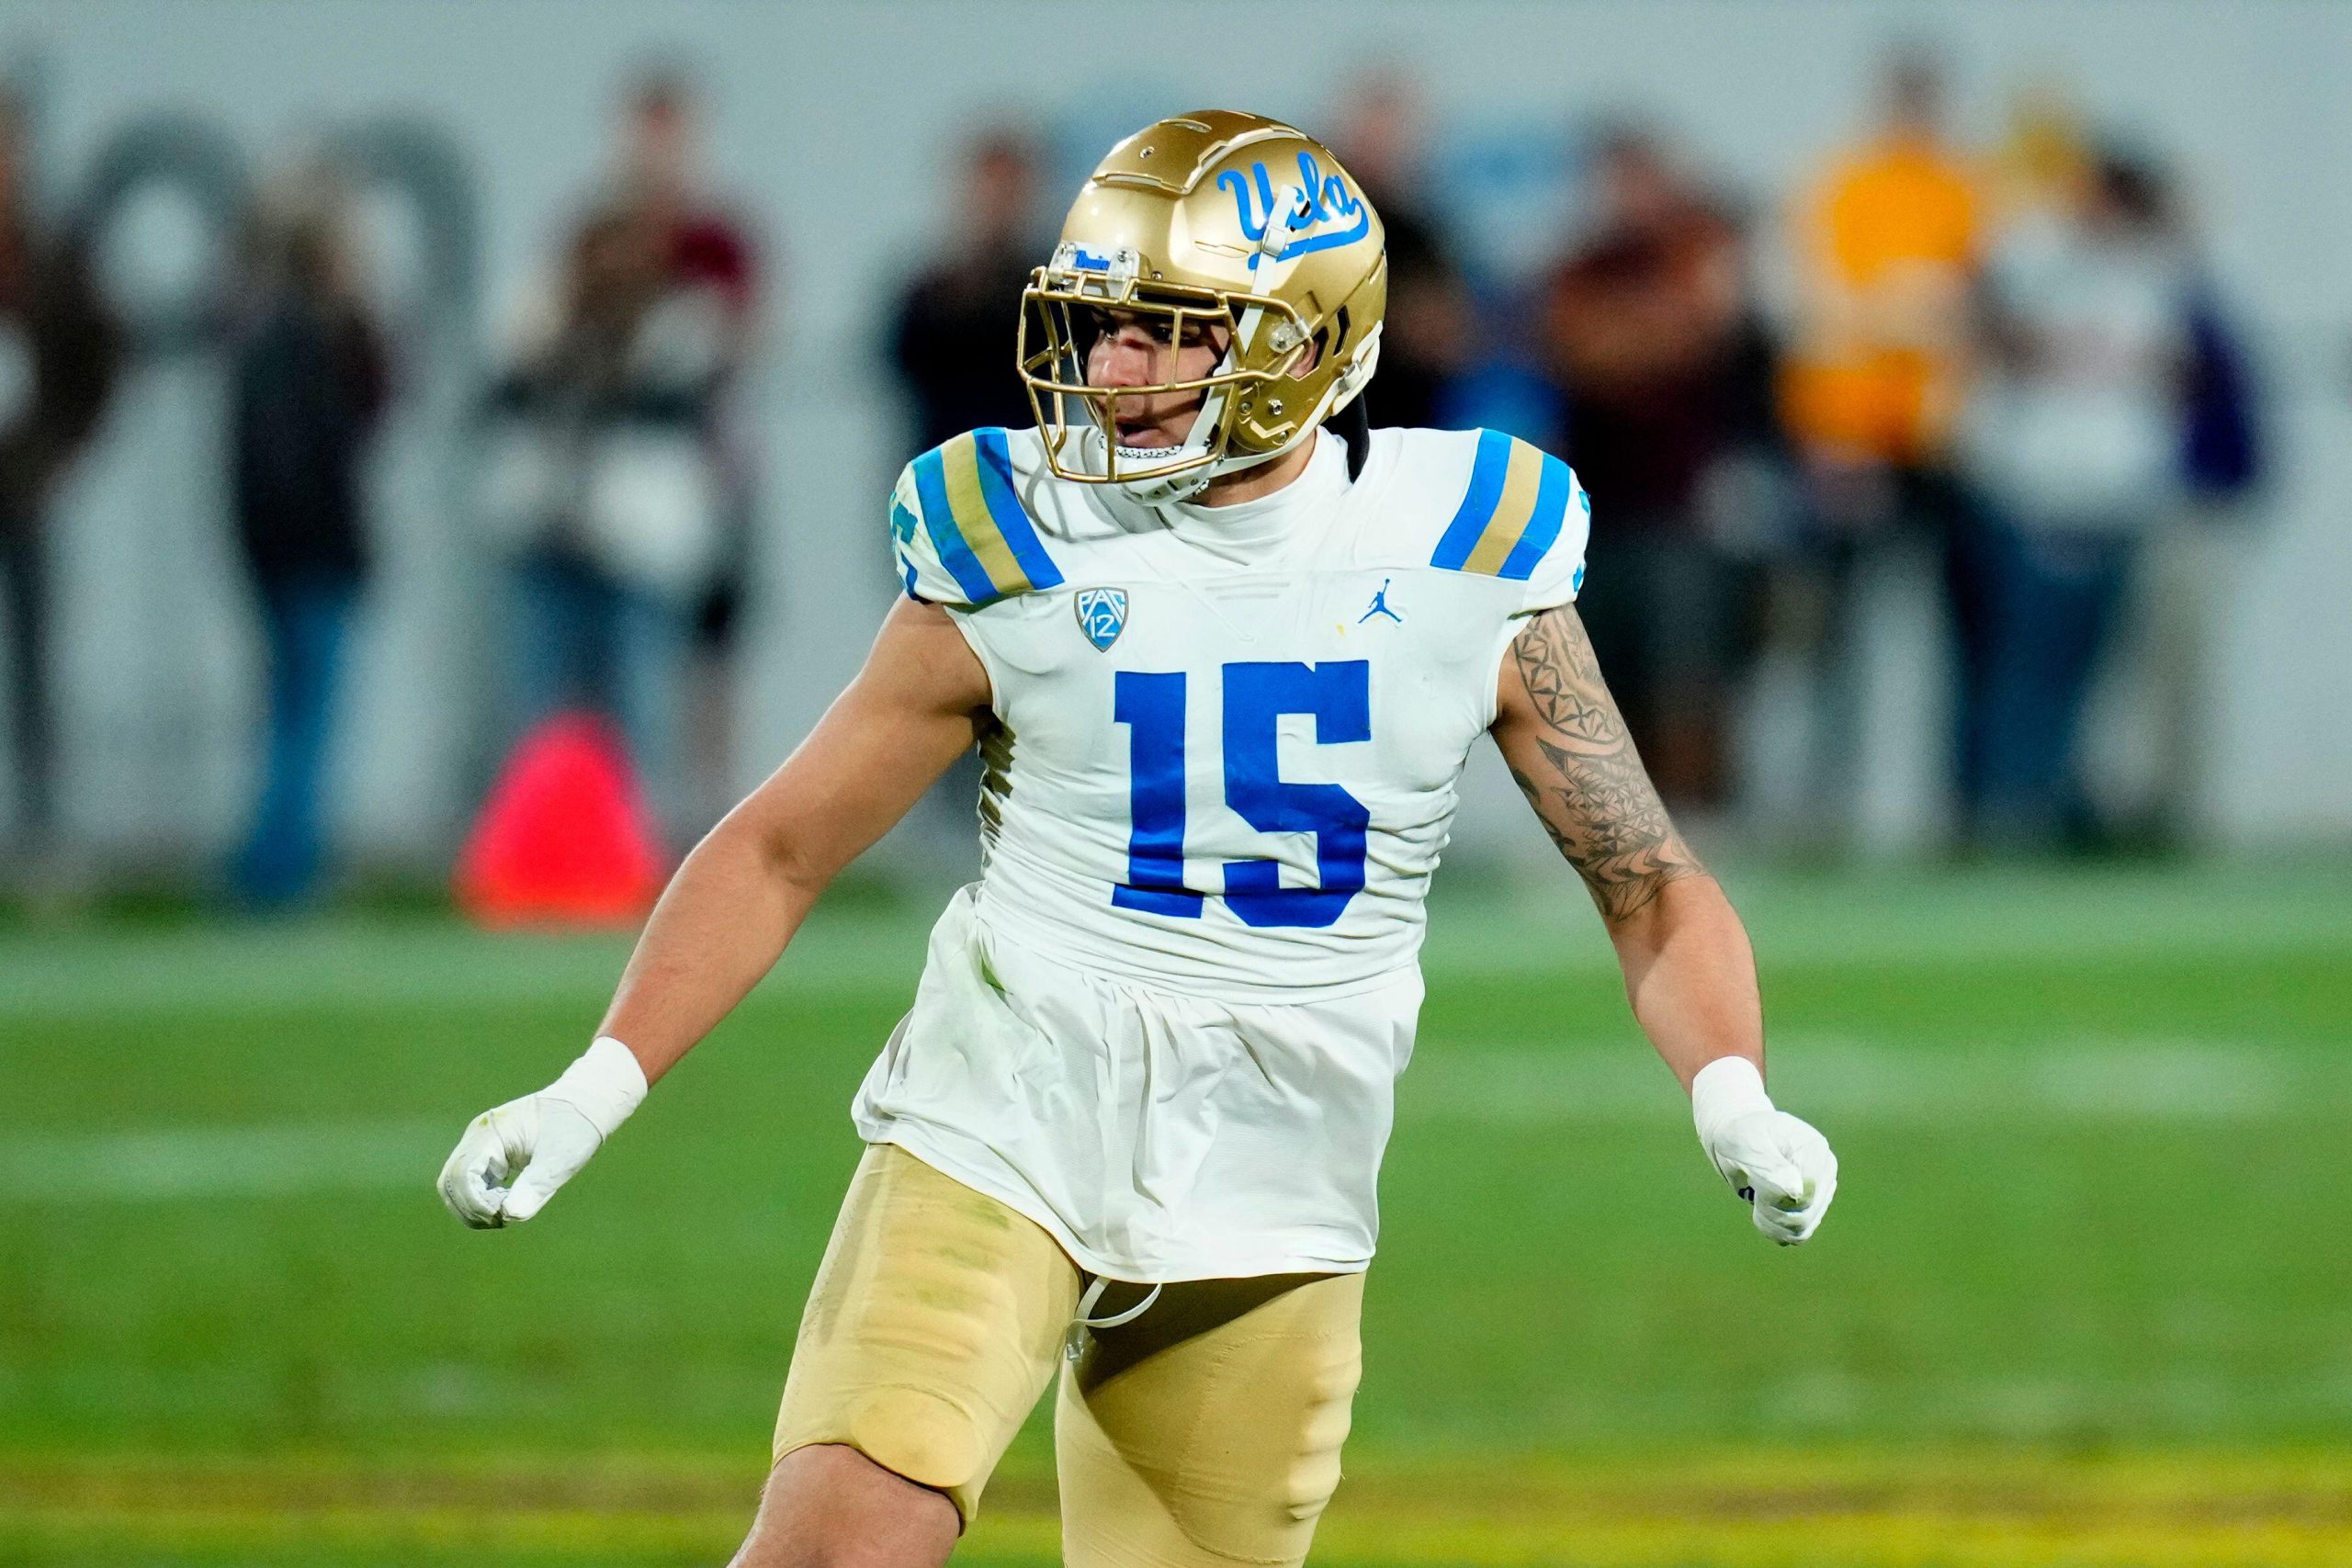
Mason Cameron reveals the highest-graded edge defender in every category for the 2024 NFL Draft.
Wed, 17 Apr 24 11:45:43 +0000
Sam Monson breaks down Toledo cornerback Quinyon Mitchell's NFL prospects.
Wed, 17 Apr 24 11:30:17 +0000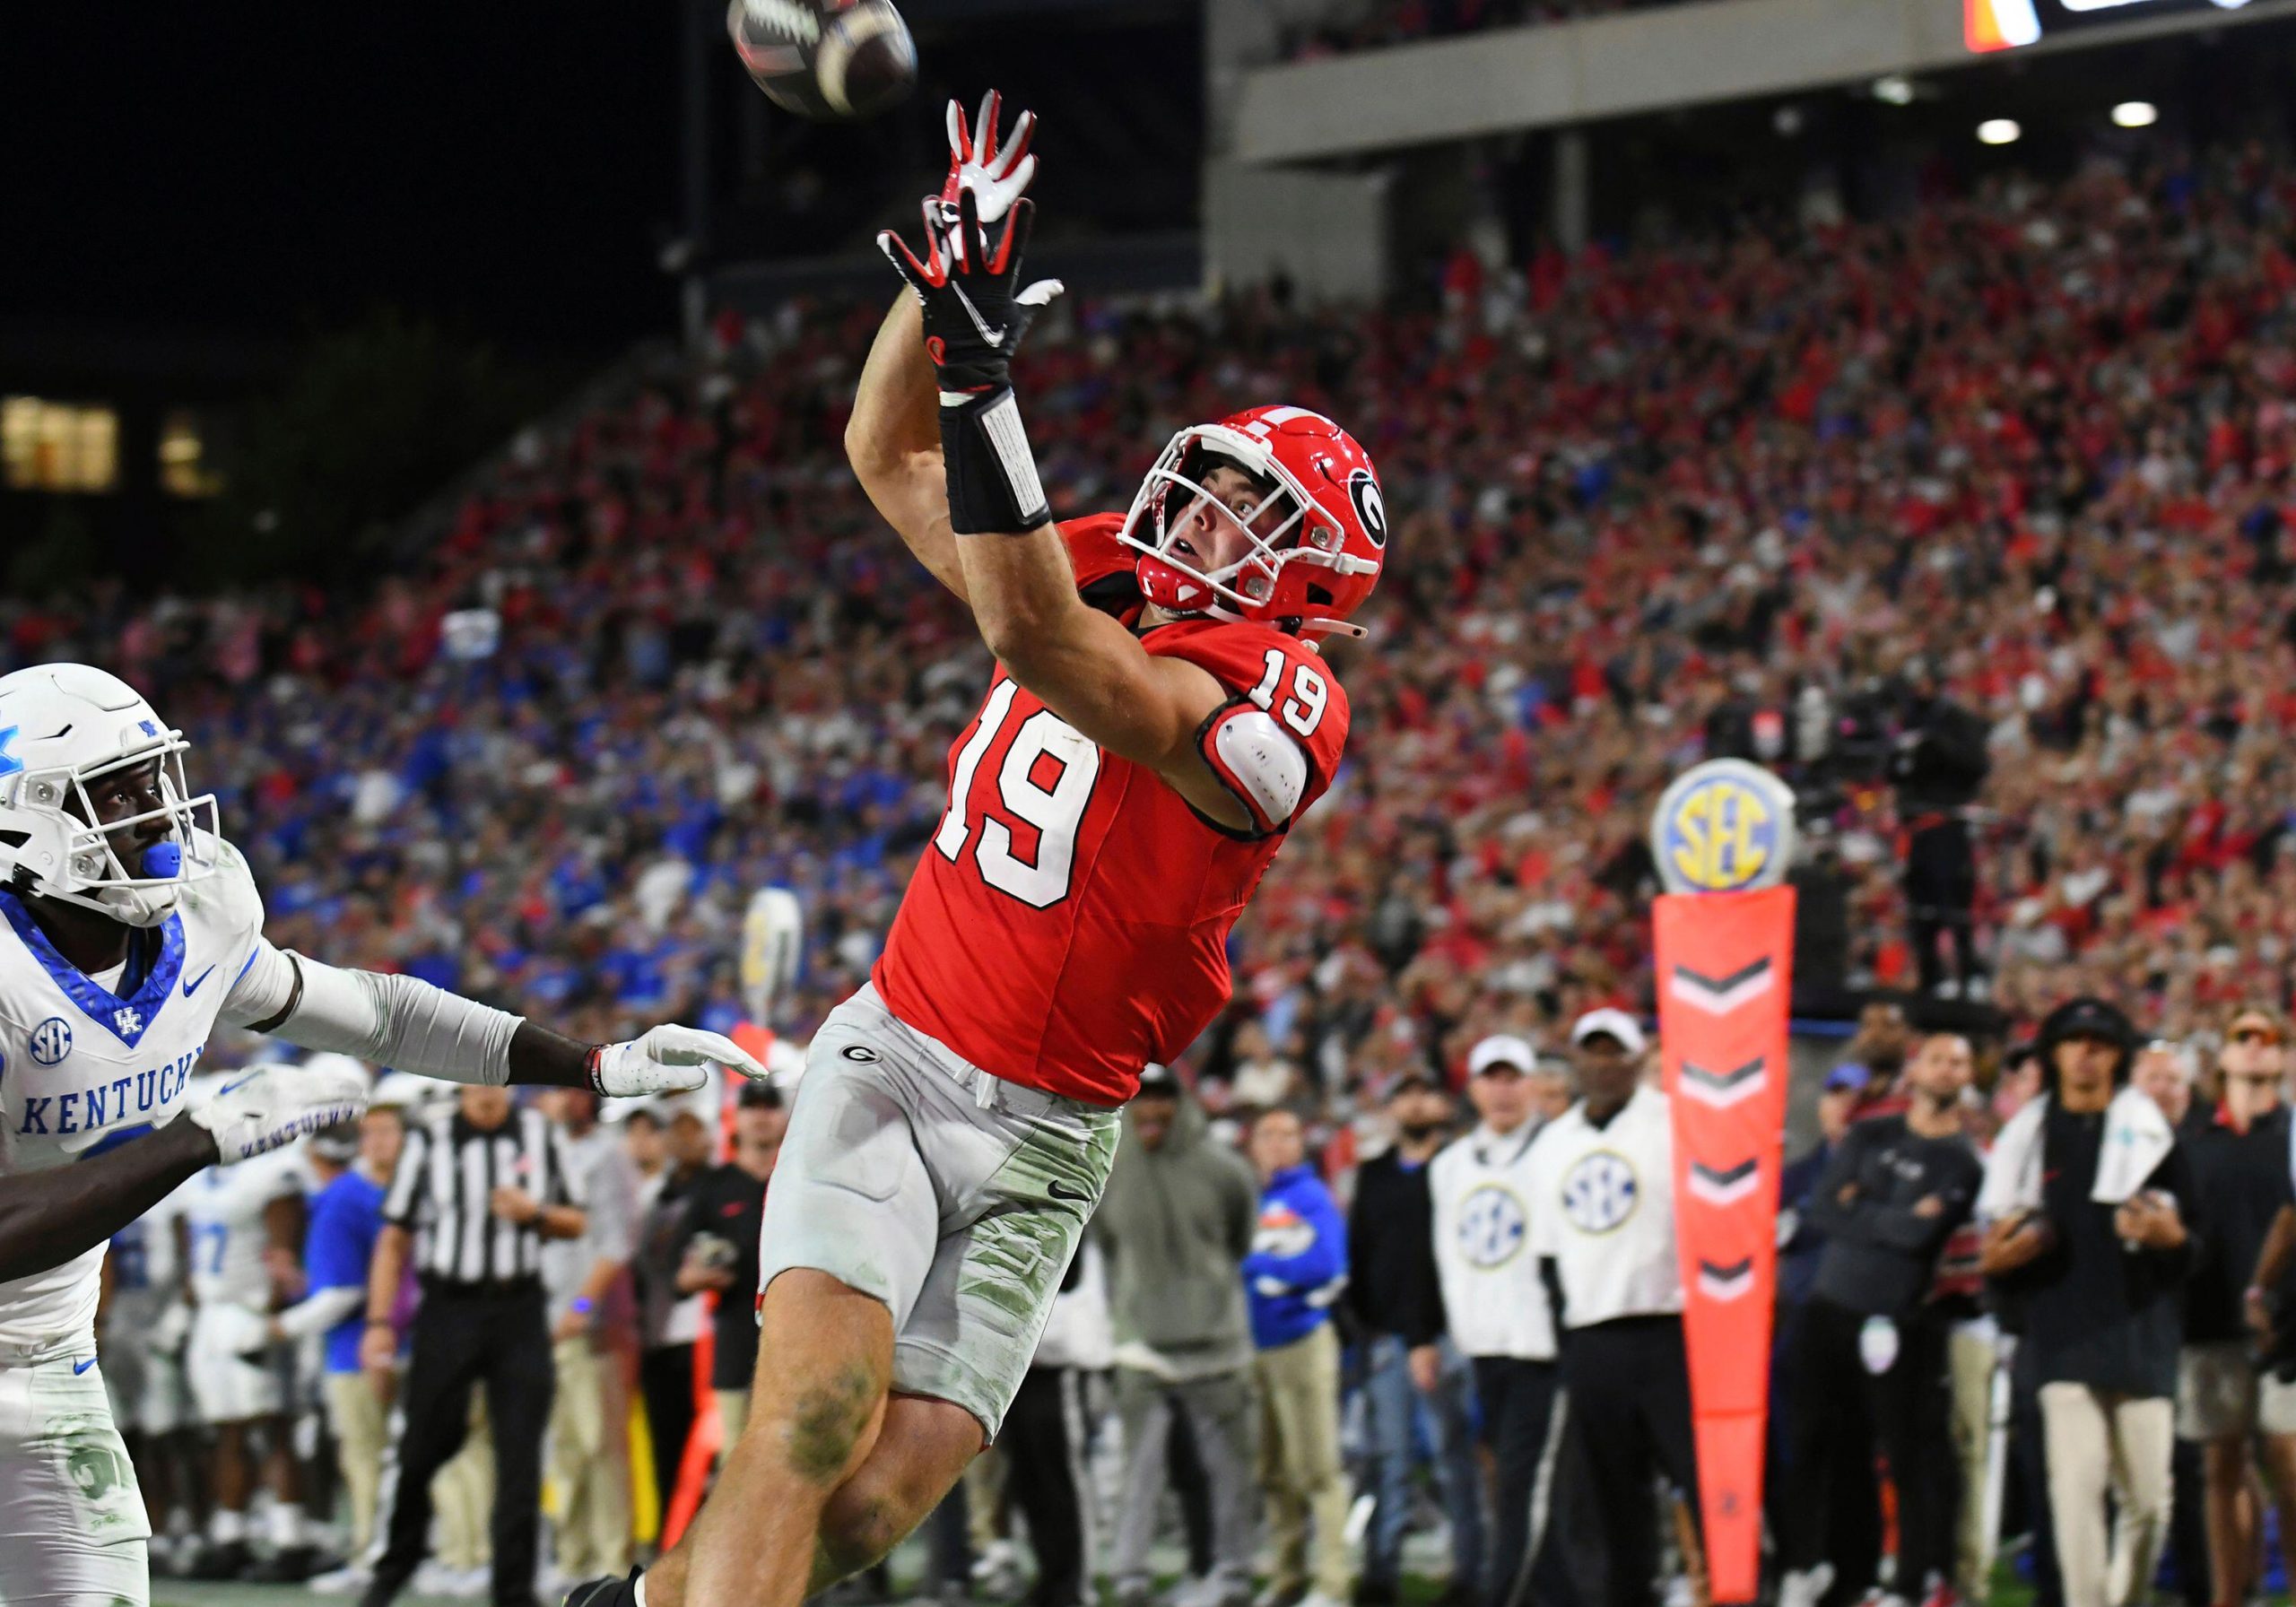
Jon Macri reveals his tight end rankings for the 2024 NFL Draft with a fantasy football slant.
Wed, 17 Apr 24 11:15:36 +0000
Max Chadwick details the top-10 safety prospects if everyone in college football was eligible in the 2024 NFL Draft.
Wed, 17 Apr 24 10:45:26 +0000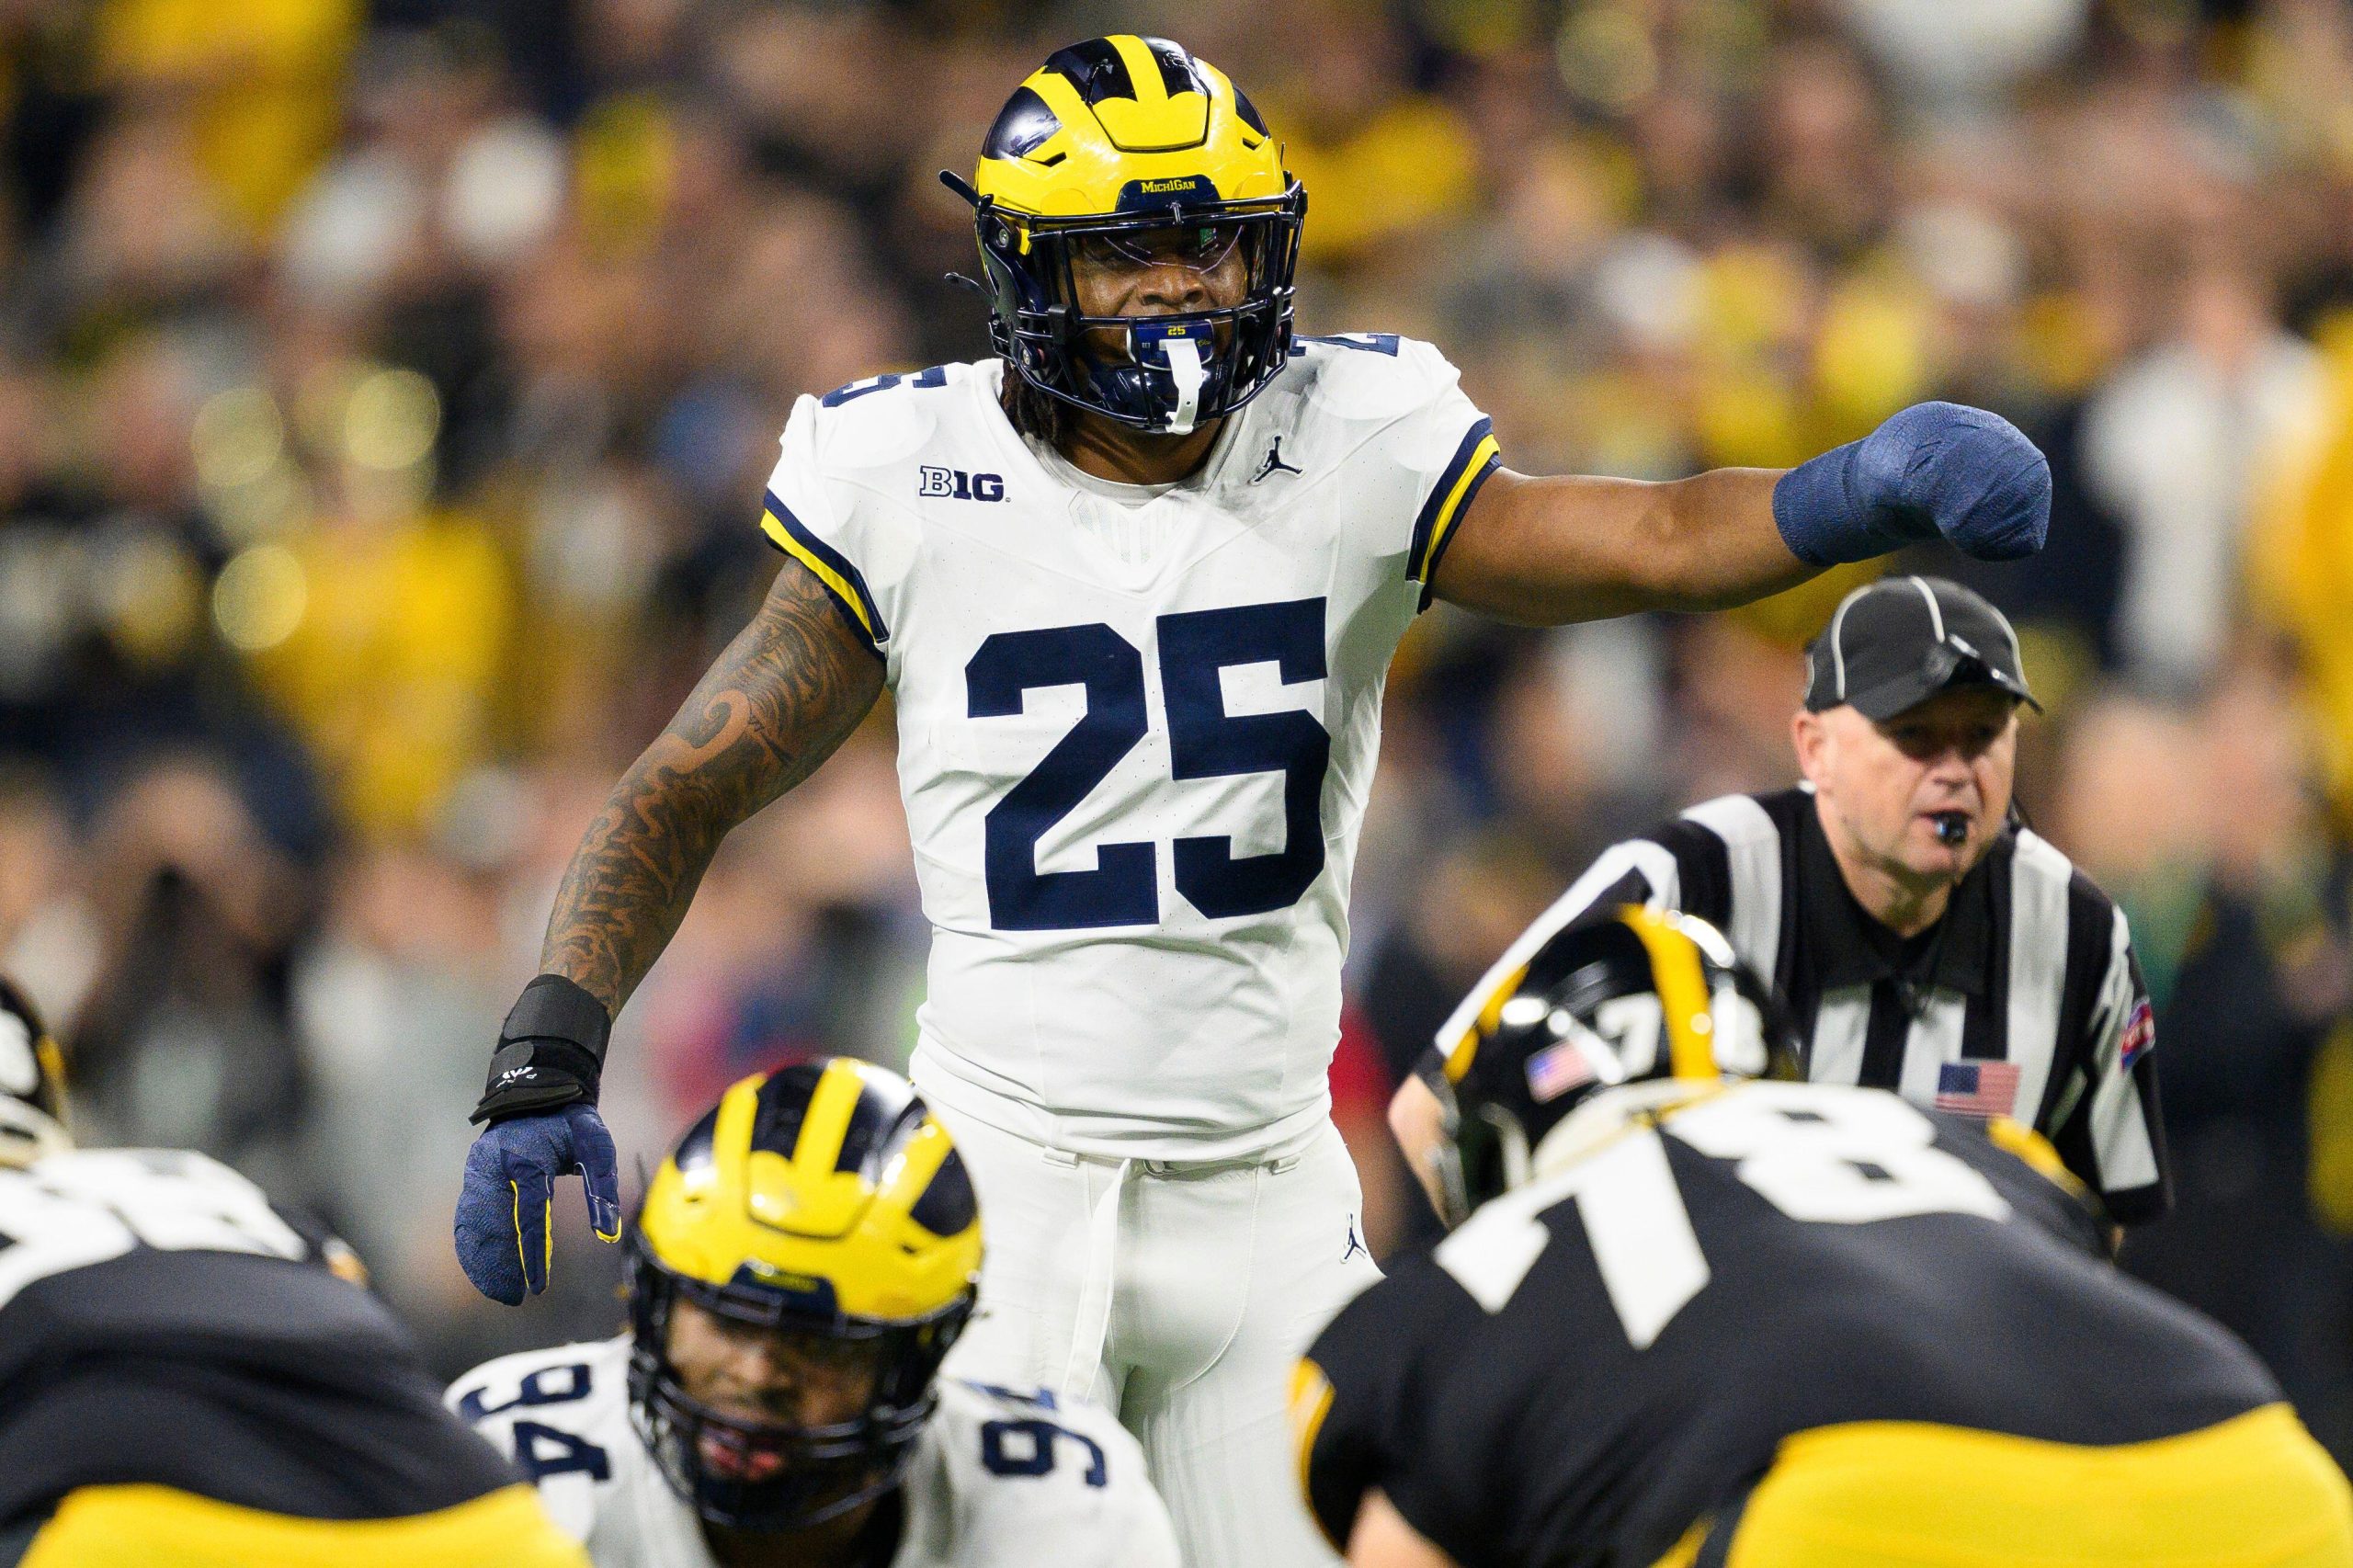
Colson's background and journey to this point are inspiring. He has the size and football IQ to play in the NFL. He is a good but not great athlete, which will likely make him a Day 2 pick as a rotational 4-3 linebacker with starting potential.
Wed, 17 Apr 24 09:45:36 +0000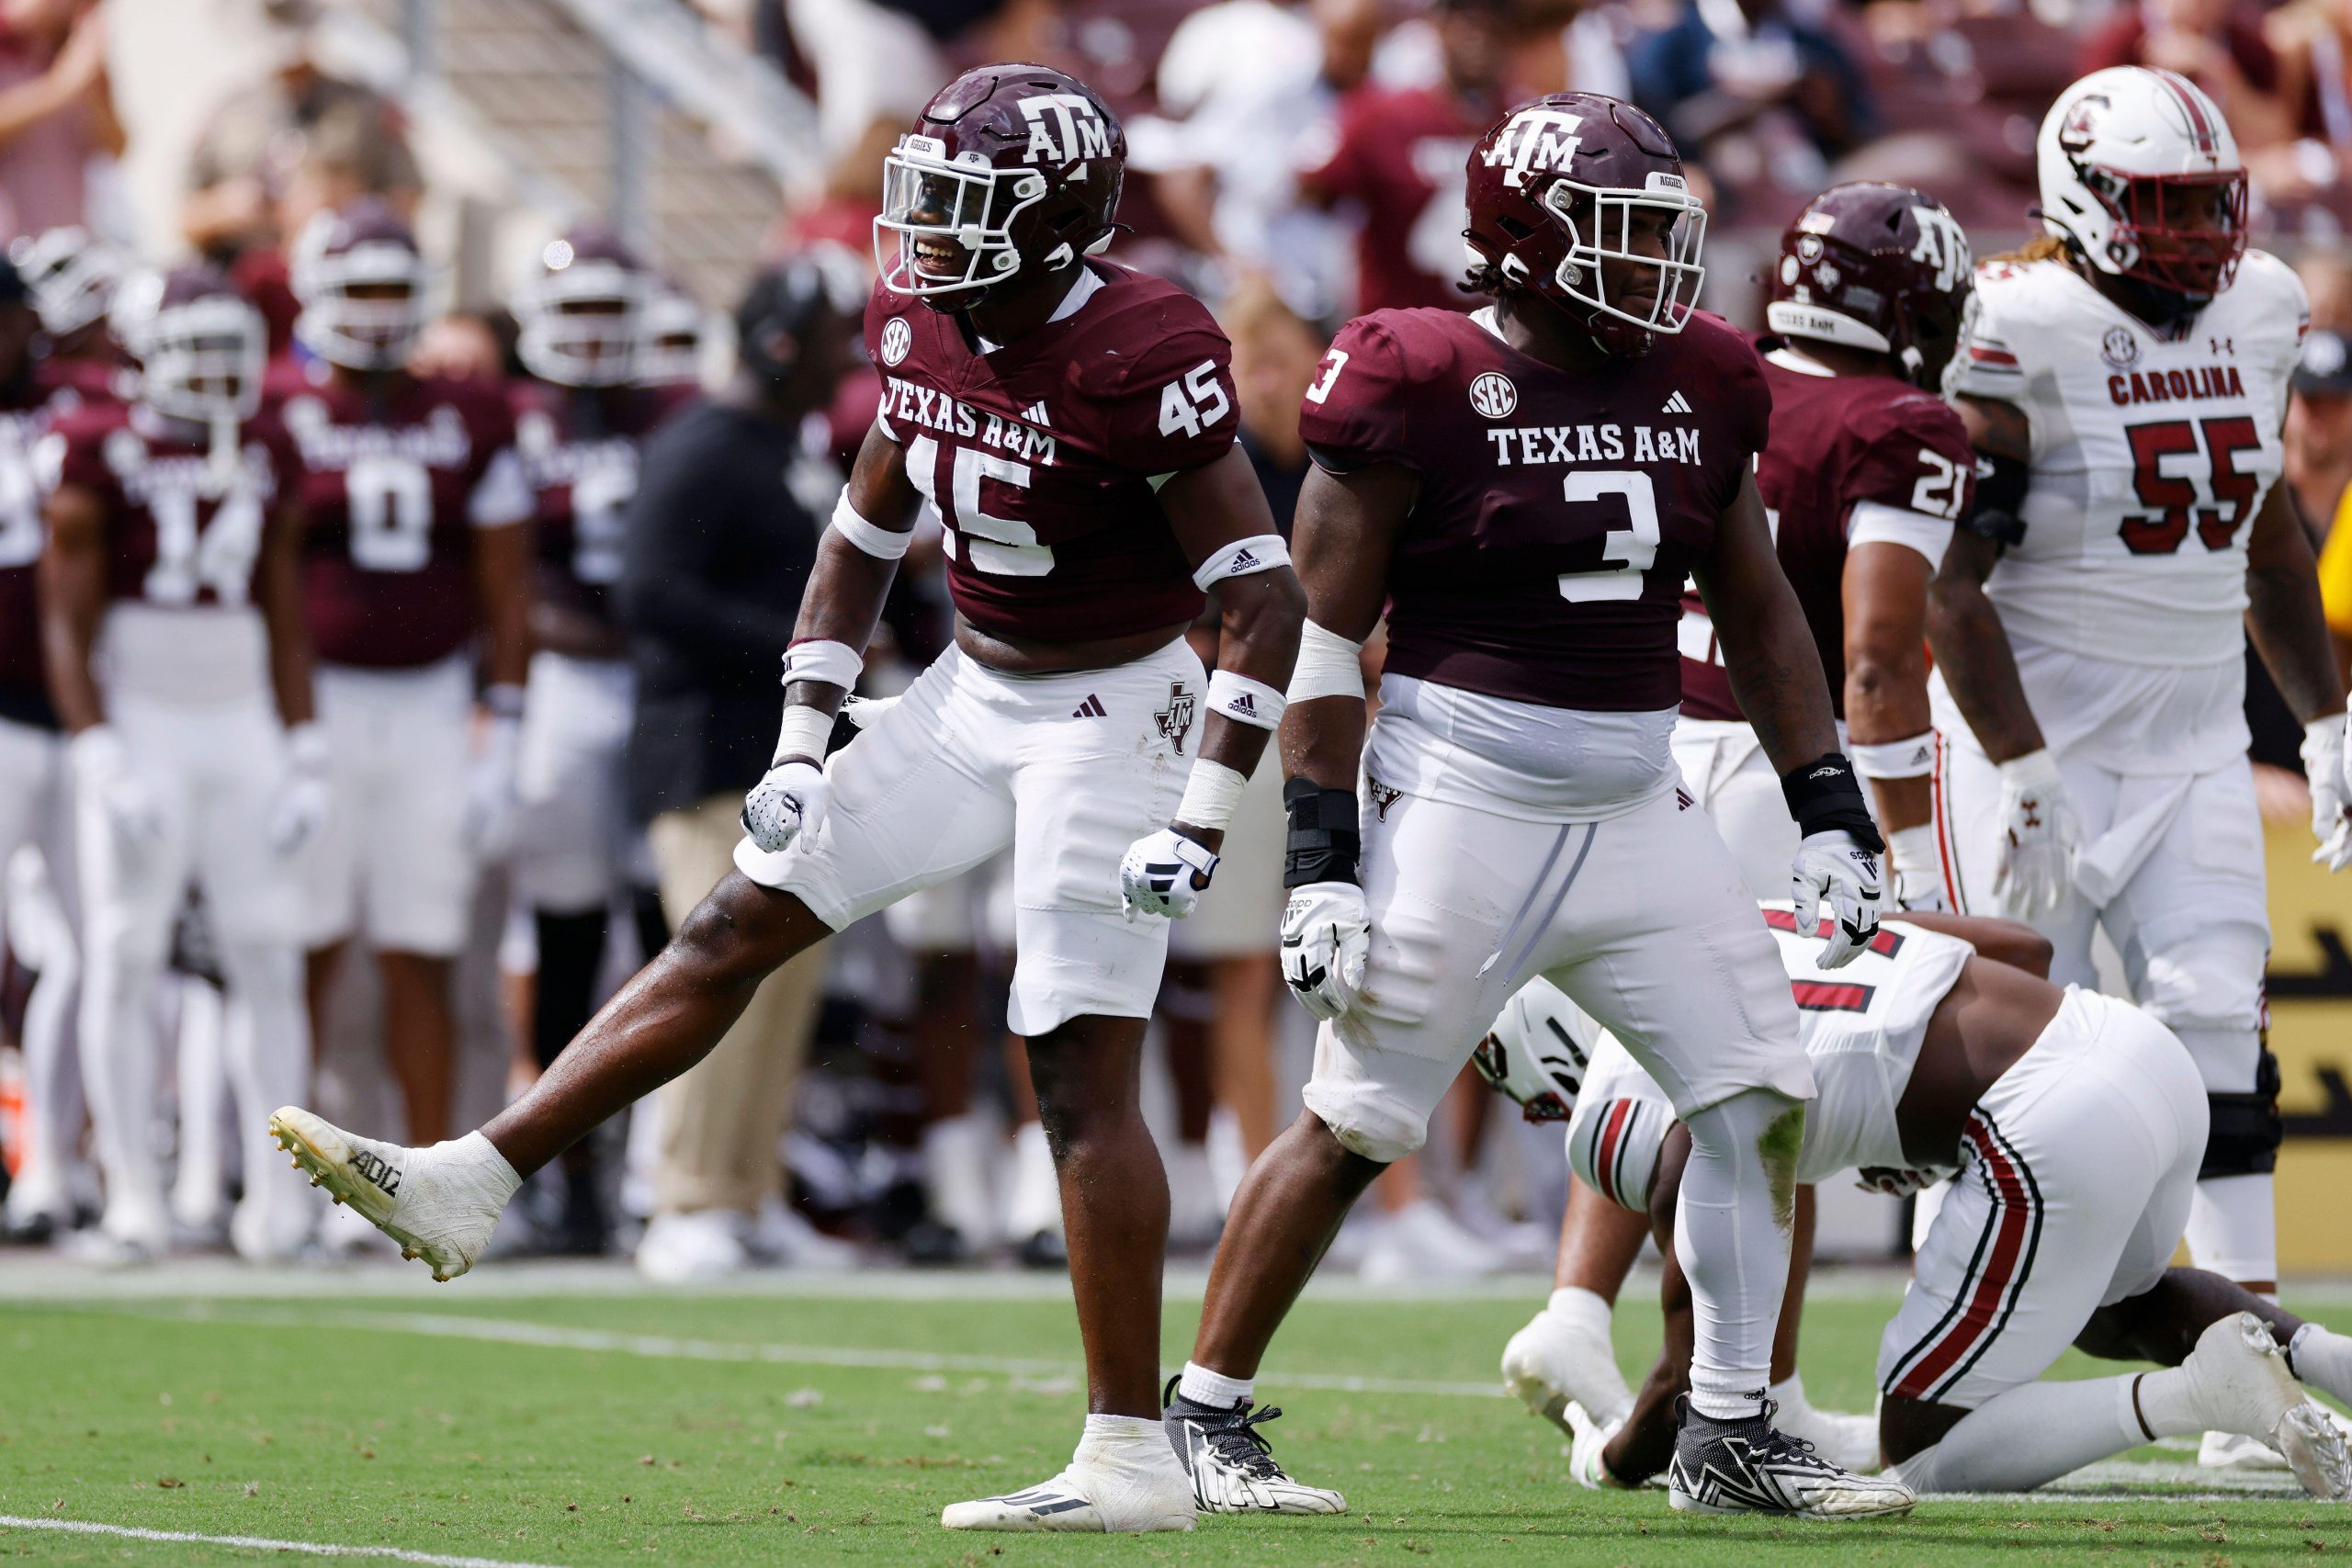
Cooper has the length and athleticism to be a starting-caliber linebacker in the NFL in a downhill role. However, his lack of anticipation and instincts for deeper coverage work will likely keep him from being picked in the first round.
Wed, 17 Apr 24 09:30:07 +0000
NC State's Payton Wilson has the length, movement skills, IQ and tape of a first-round linebacker.
Wed, 17 Apr 24 09:15:03 +0000
Nathan Jahnke reveals his 2024 NFL mock draft.
Wed, 17 Apr 24 09:00:50 +0000All Featured Tools
-
Our exclusive database, featuring the most in-depth collection of NFL player performance data.
Available with
PFF All News & Analysis
The latest football news, analysis, and rankings from PFF. Featuring data-driven rankings and stats for NFL, fantasy football, and the NFL Draft.
