All News & Analysis

Using only the measurables as a starting point, Steve Palazzolo sets out to quantify upside and downside and identify the positions with a history of improved performance based on athletic measures alone.
Wed, 24 Apr 24 16:20:10 +0000
Over the last two weeks, PFF has mapped out the NFL draft landscape, constructing seven-round mock drafts for all 32 NFL teams with the help of the PFF mock draft simulator.
Wed, 24 Apr 24 14:46:42 +0000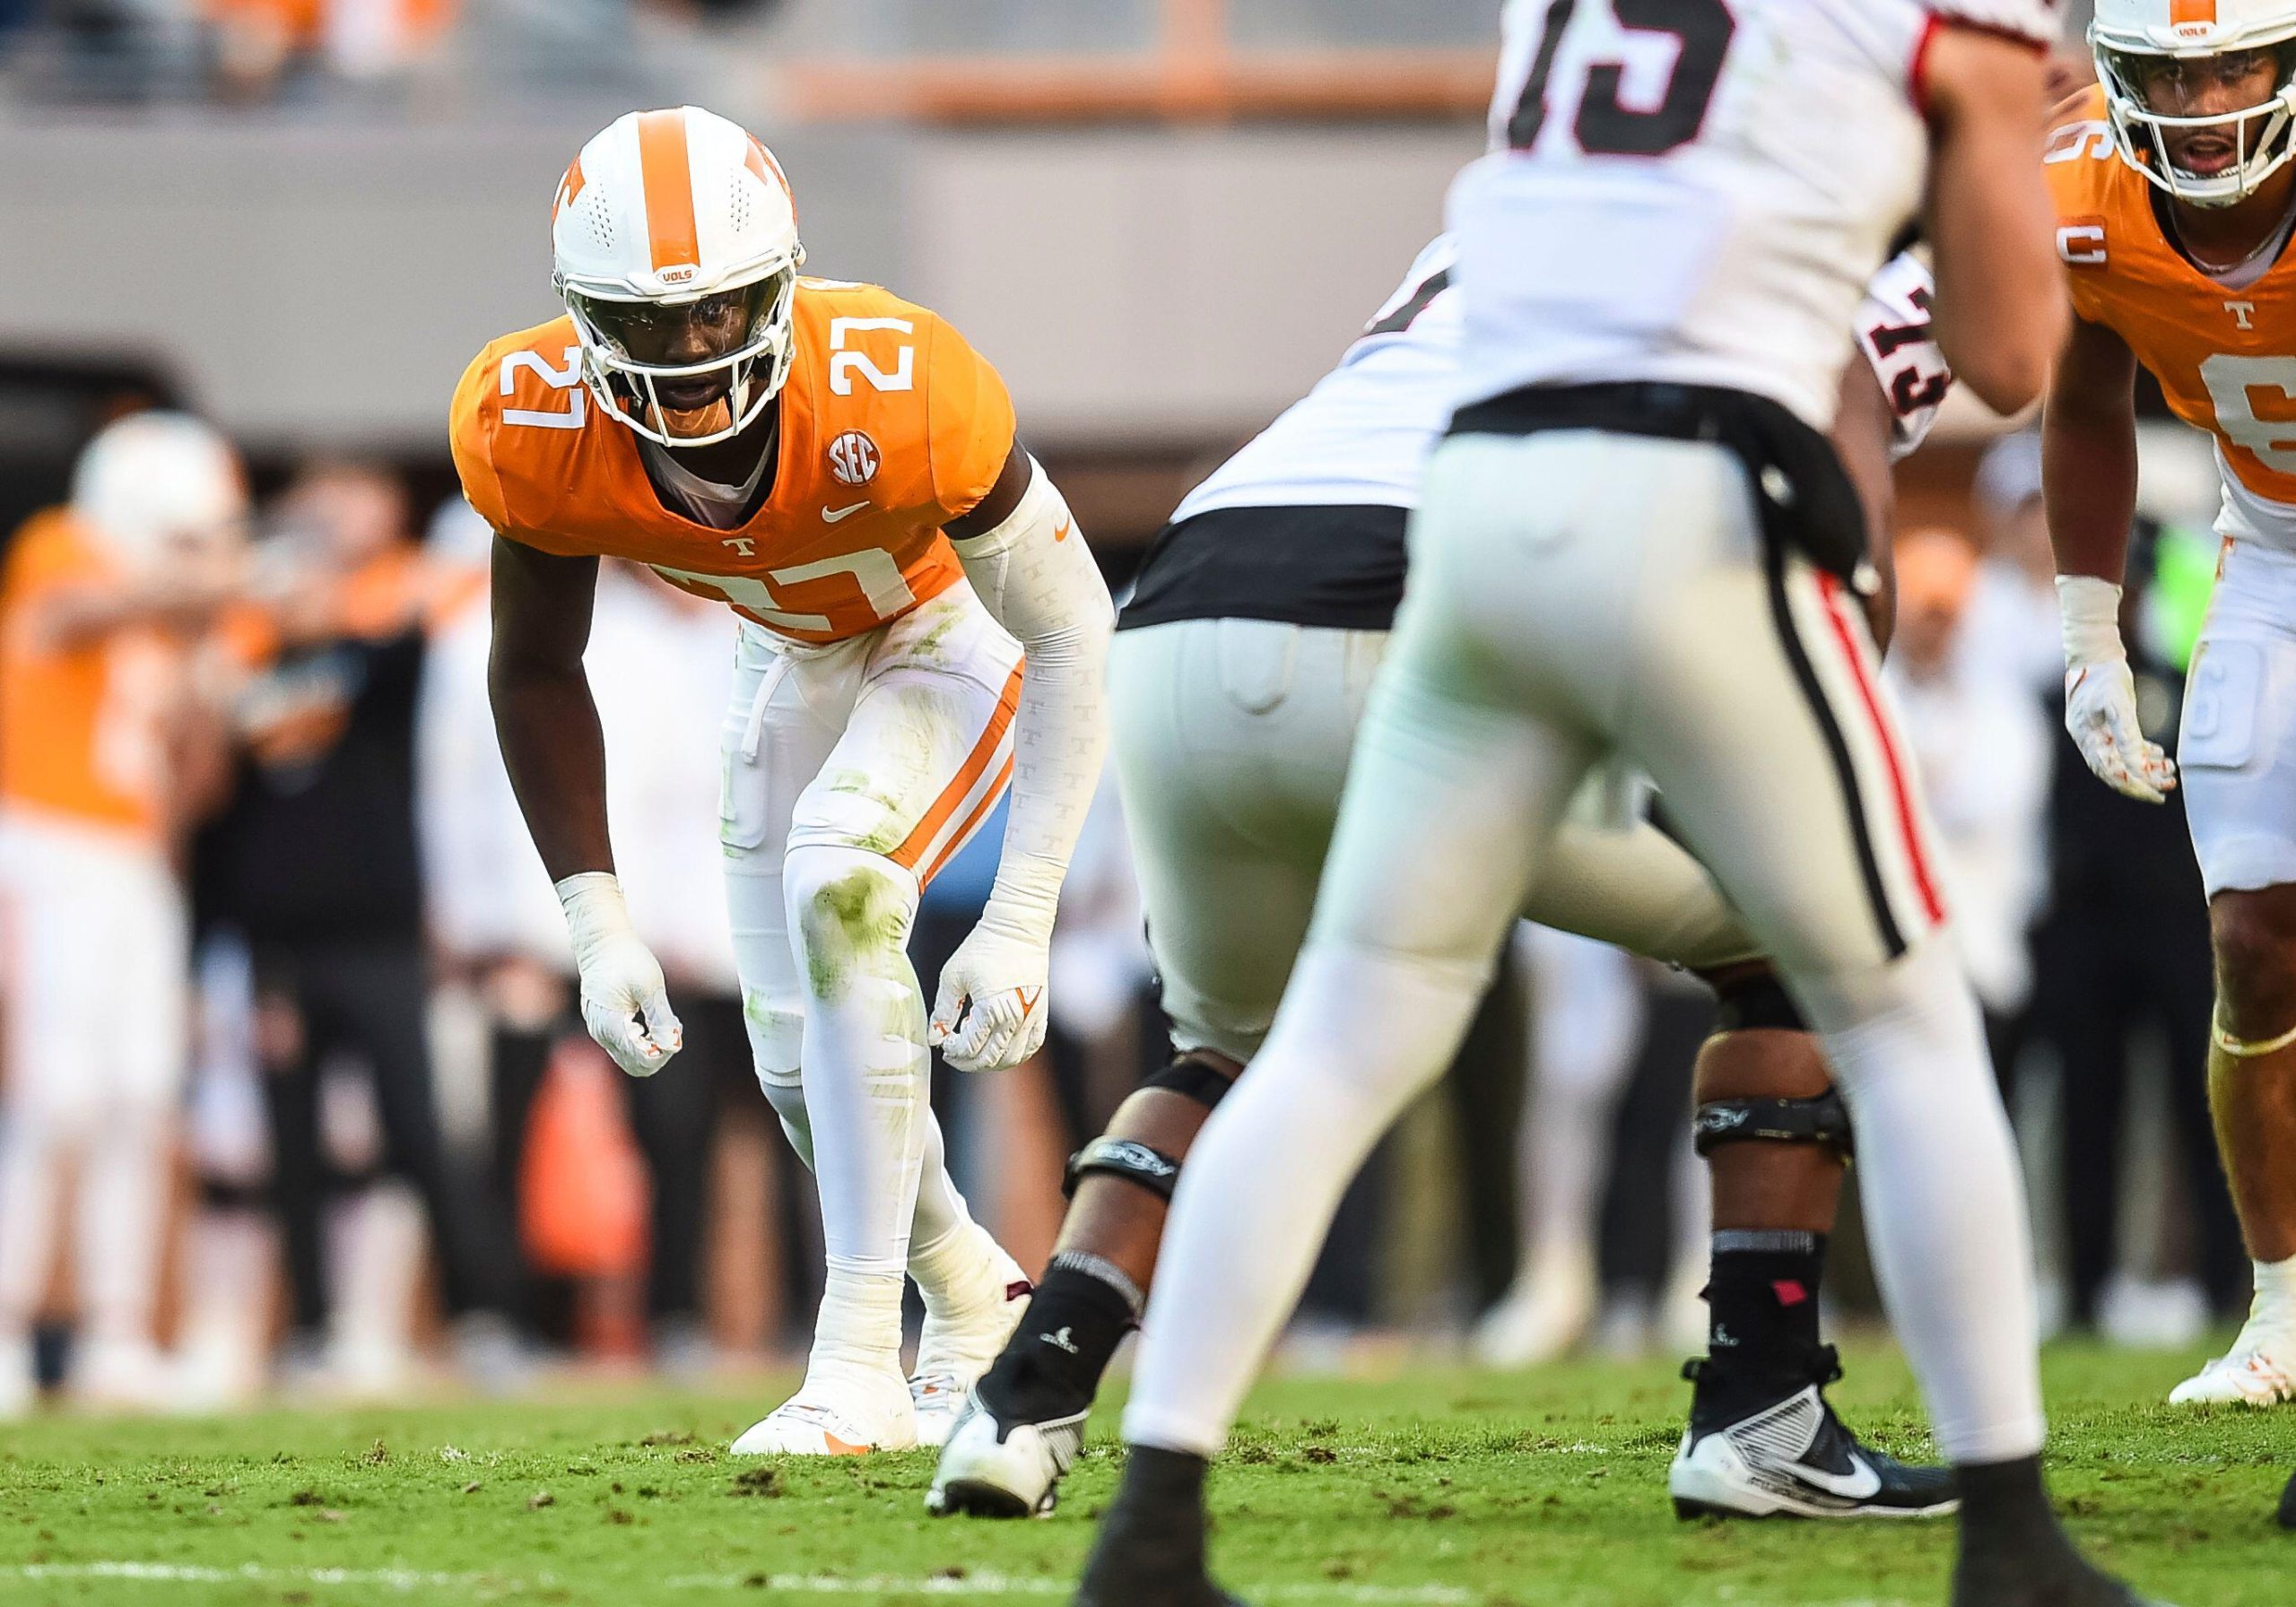
What would the 2024 NFL Draft look like if every college football player was able to declare?
Wed, 24 Apr 24 13:30:33 +0000
What if we lived in a world where teams avoided analytically unsound decisions in the draft? Well, this is exactly what this mock aims to achieve, as it reflects how teams should approach their picks from an analytical point of view.
Wed, 24 Apr 24 12:46:39 +0000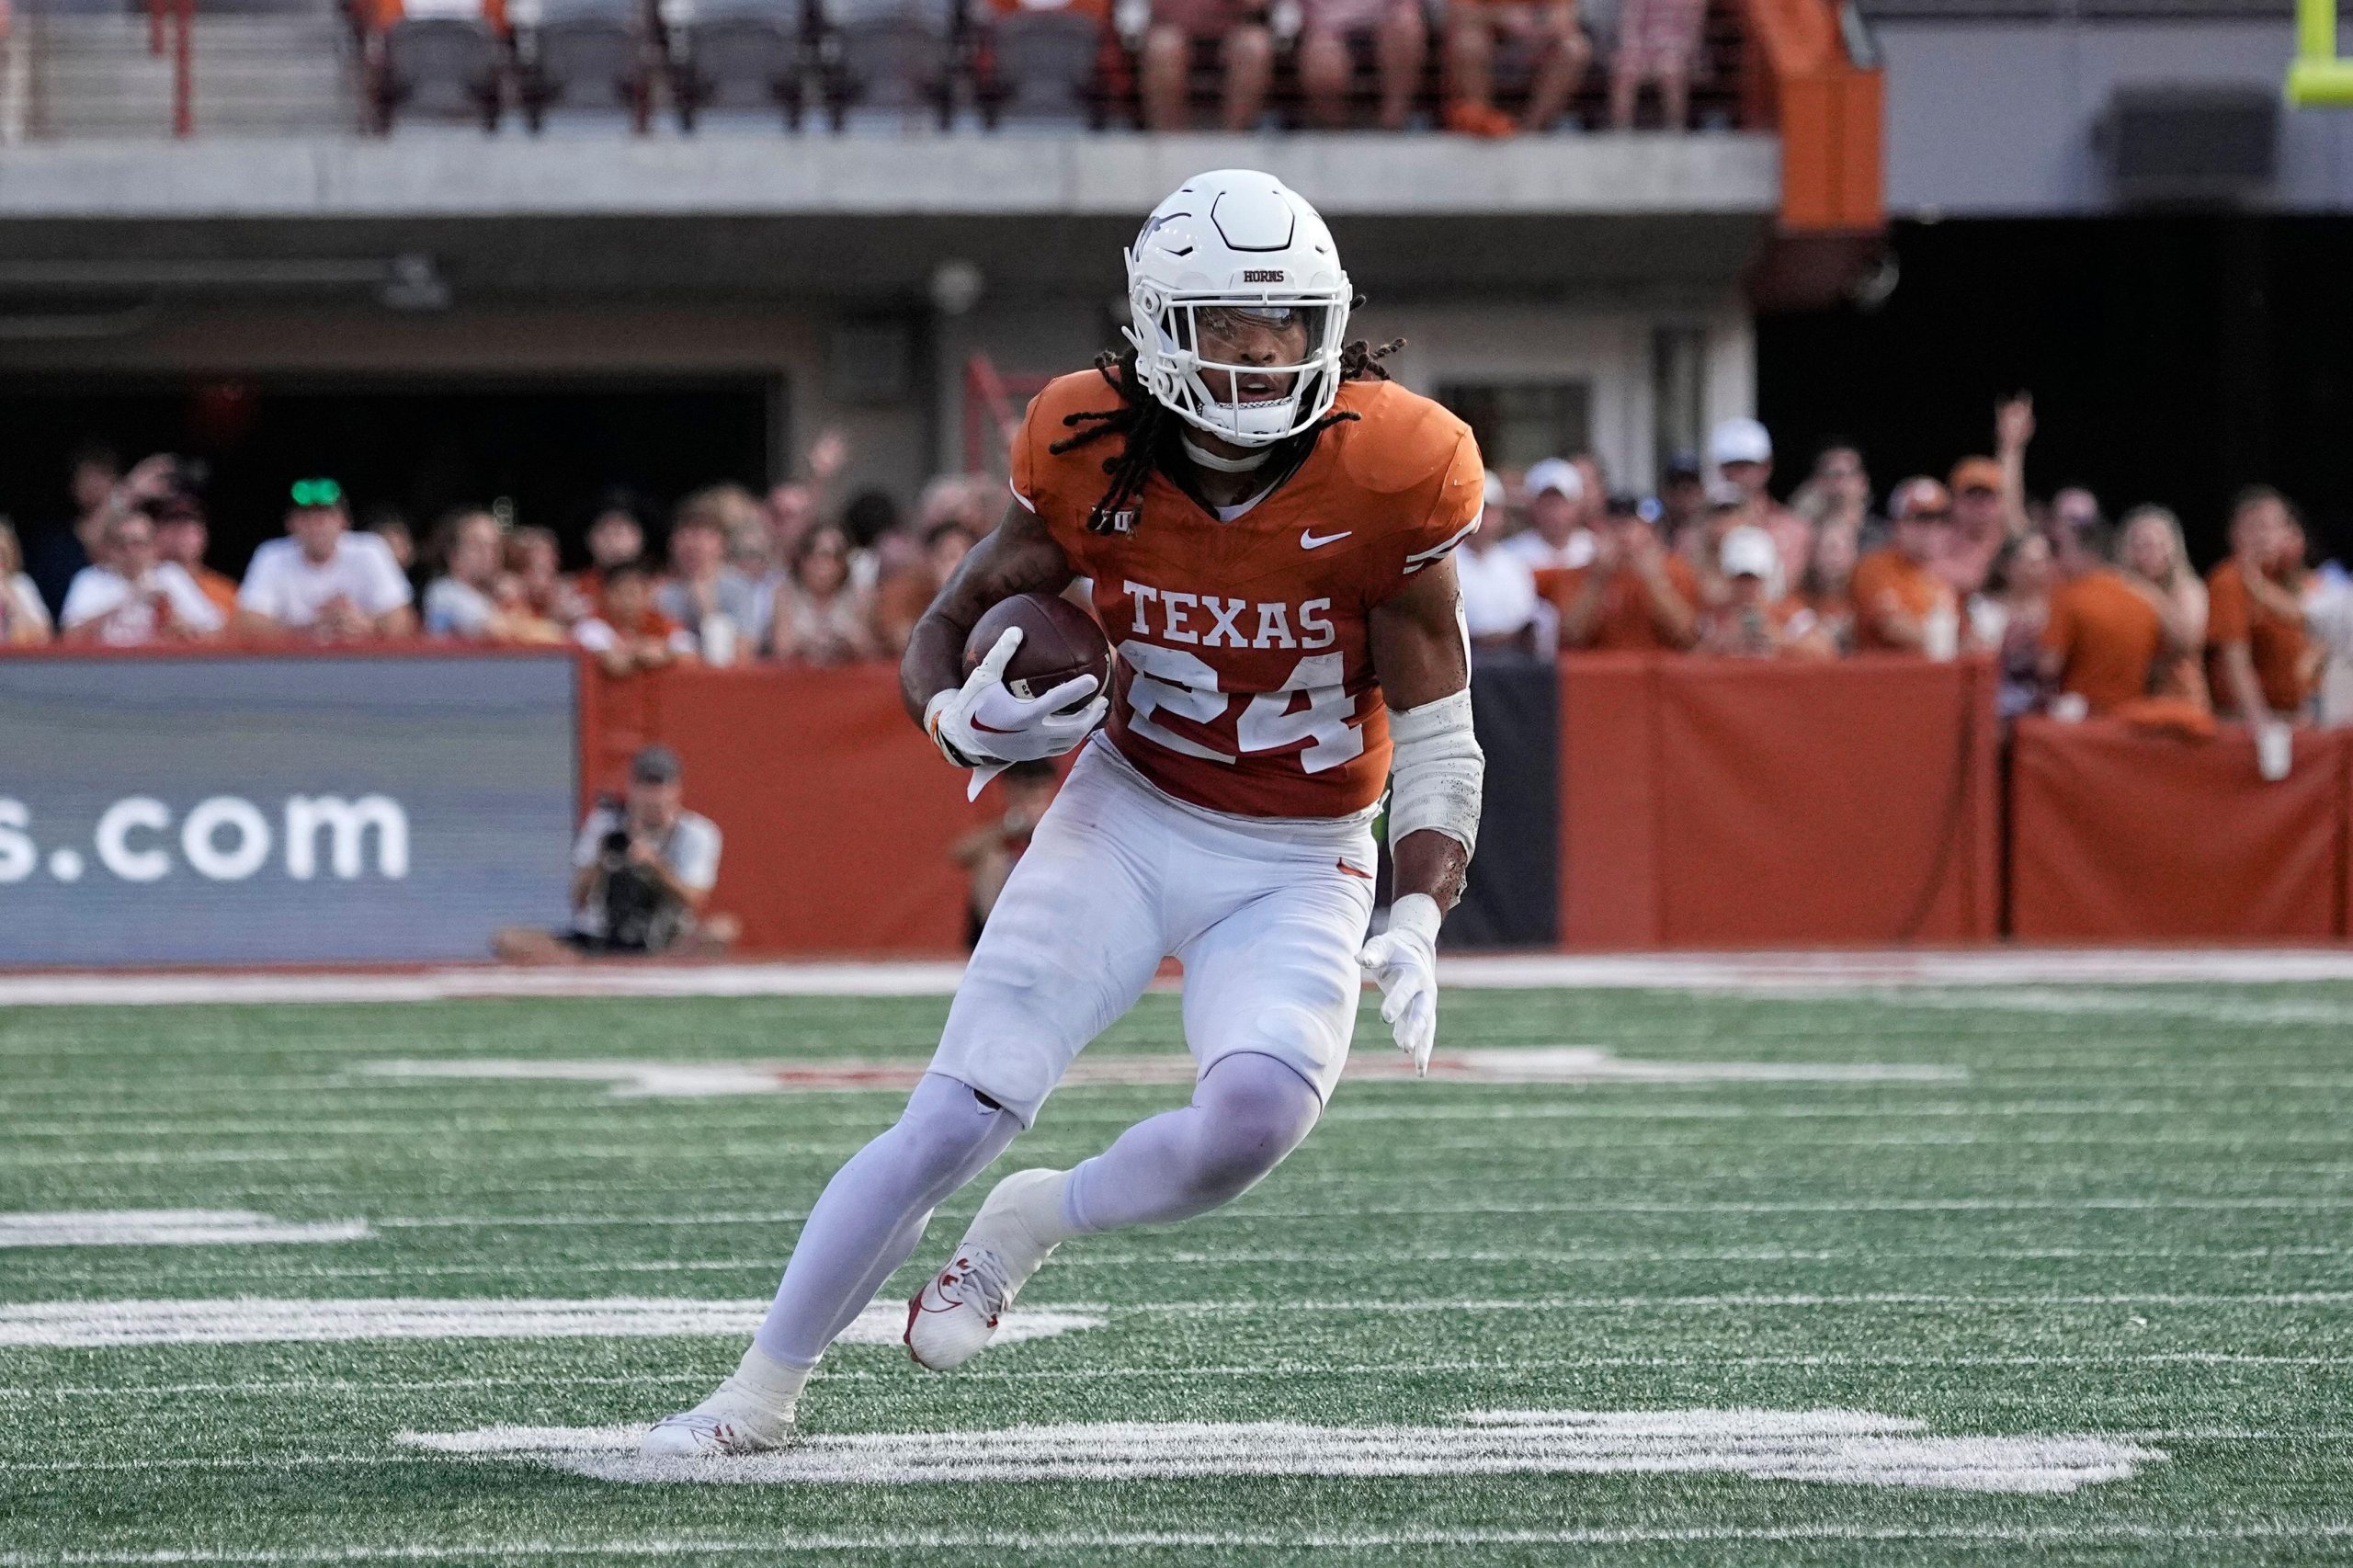
Surprise picks, huge trades and expected outcomes will all be part of the 2024 NFL Draft, and we do our best here to predict them.
Wed, 24 Apr 24 12:15:25 +0000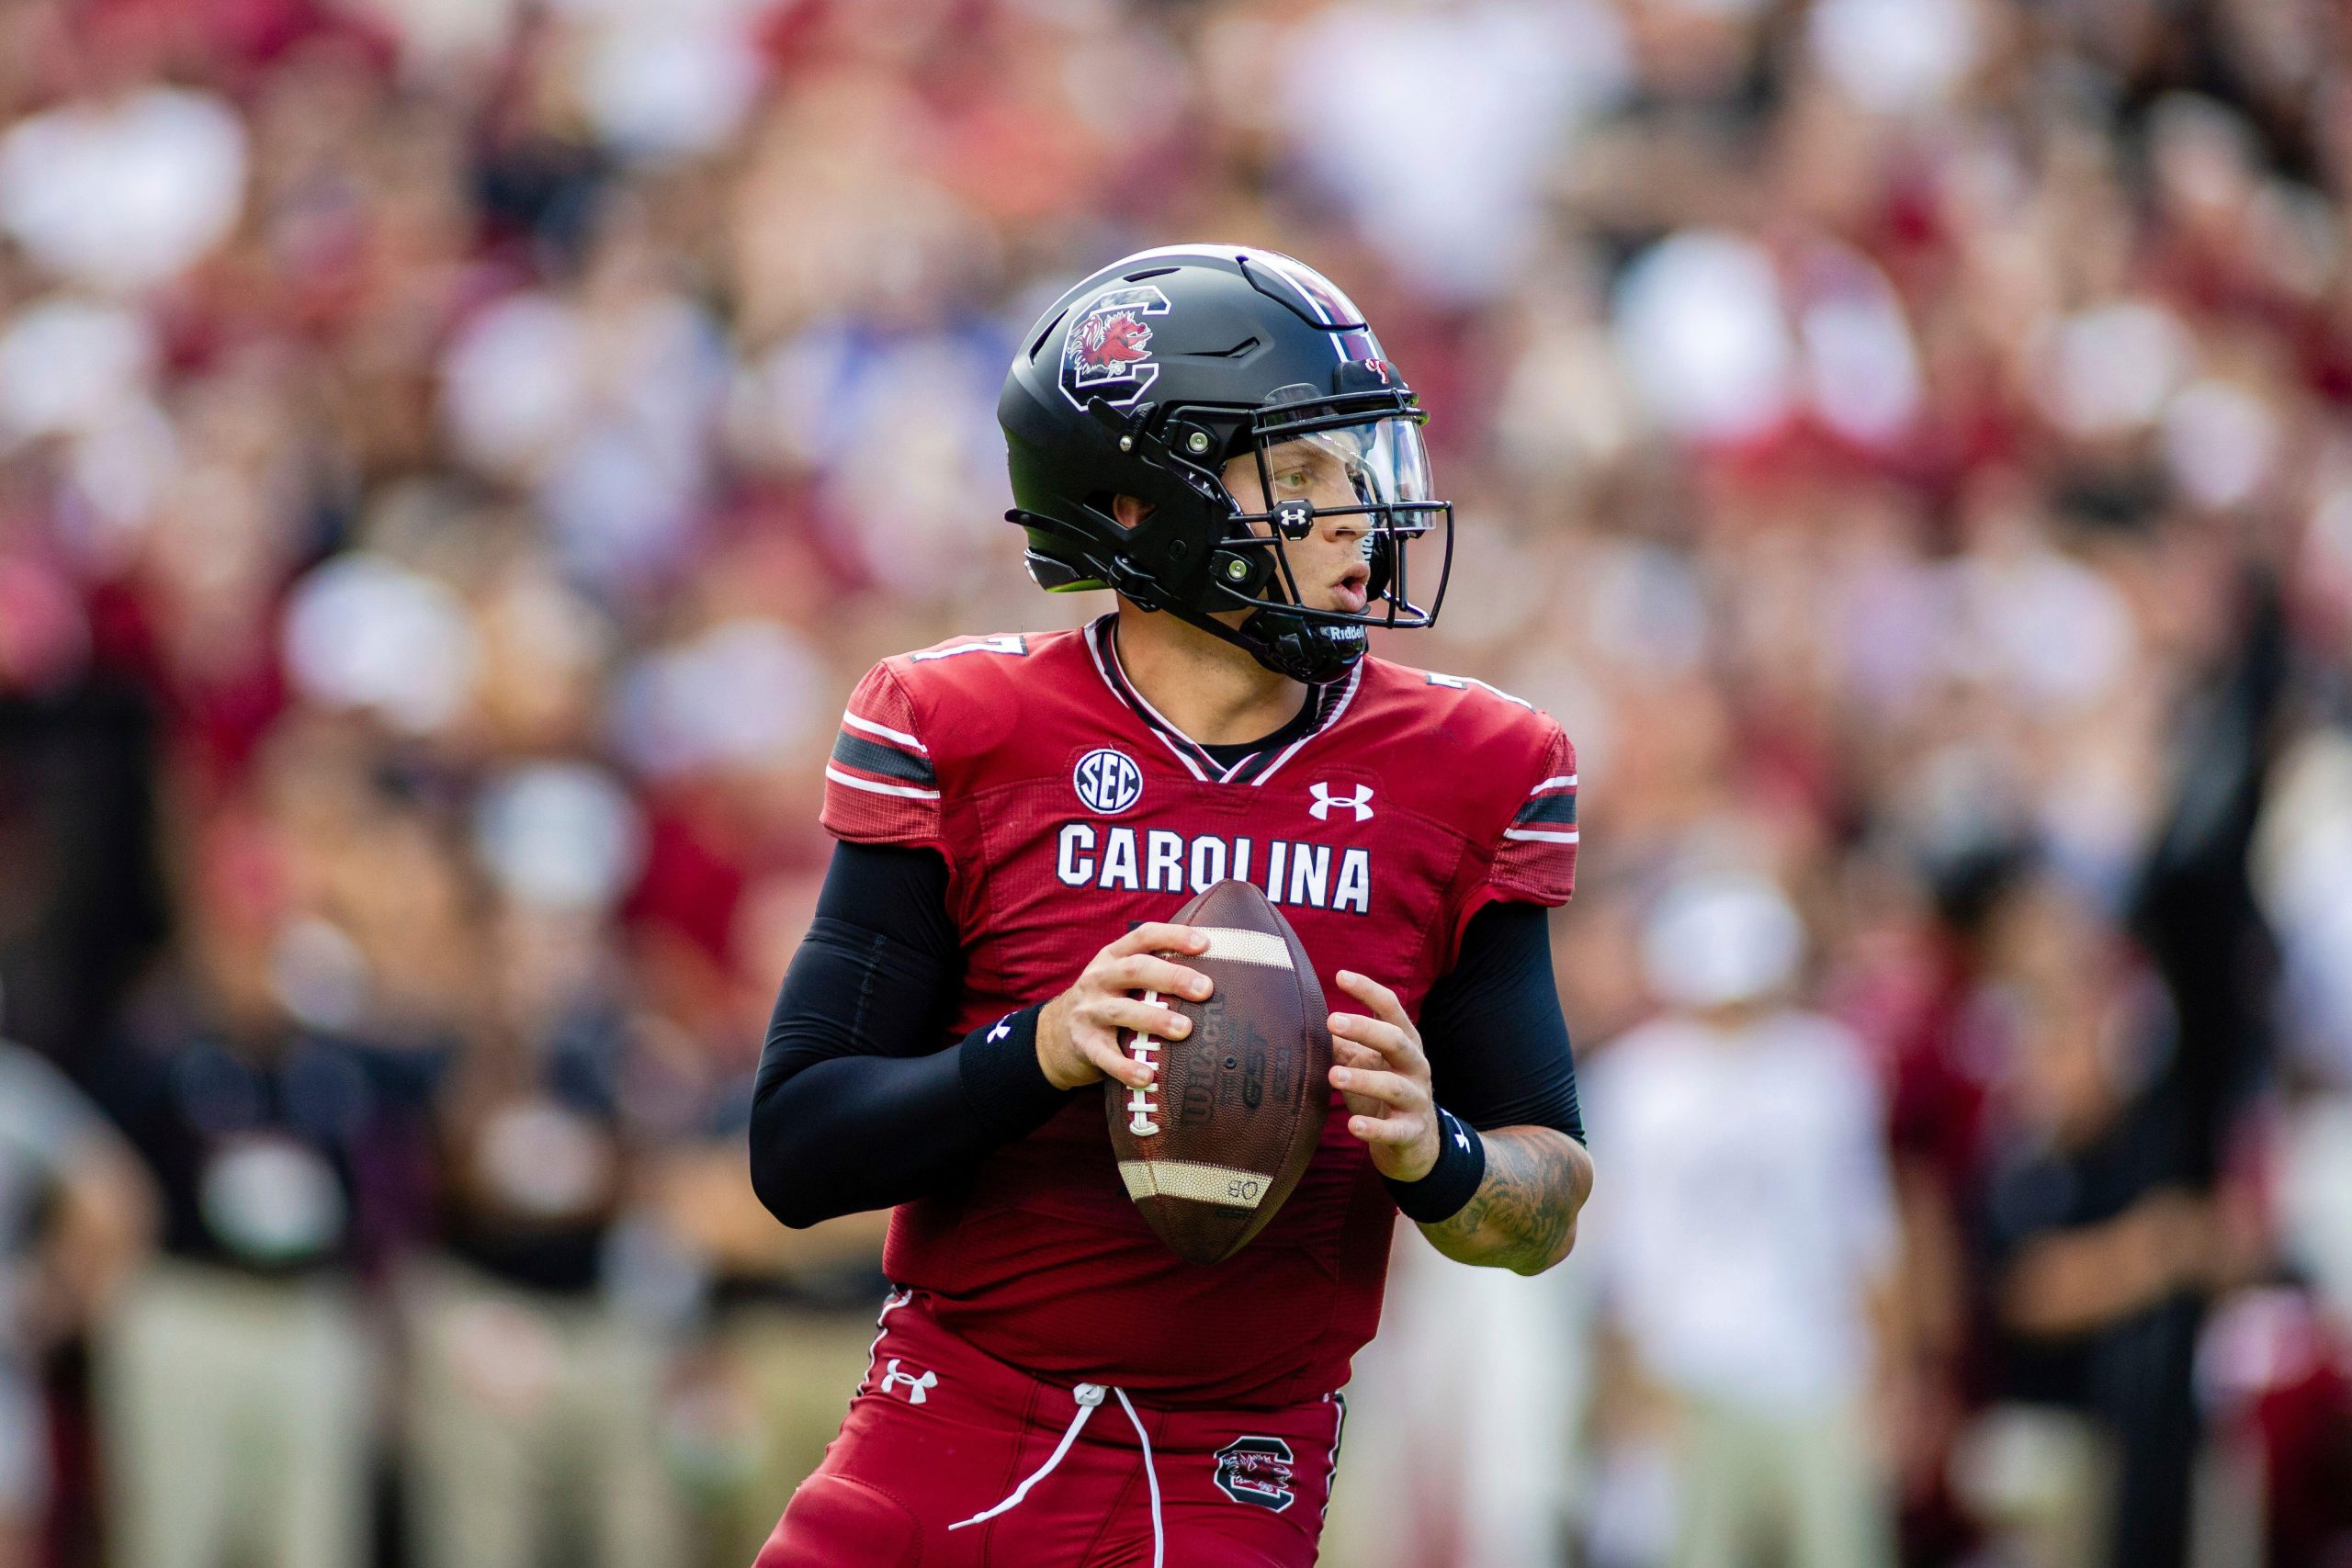
The 2024 NFL Draft features a sizable late-round quarterback group, all of whom have weaknesses to work on.
Wed, 24 Apr 24 11:45:29 +0000
Penn State offensive tackle Olu Fashanu has his weaknesses, but he has slid too far in the pre-draft process.
Wed, 24 Apr 24 11:30:59 +0000
Nic Bodiford reveals the best landing spots for the 2024 NFL Draft's running back class.
Wed, 24 Apr 24 11:00:51 +0000
Max Chadwick breaks down one thing every team must do in the 2024 NFL Draft.
Wed, 24 Apr 24 10:45:41 +0000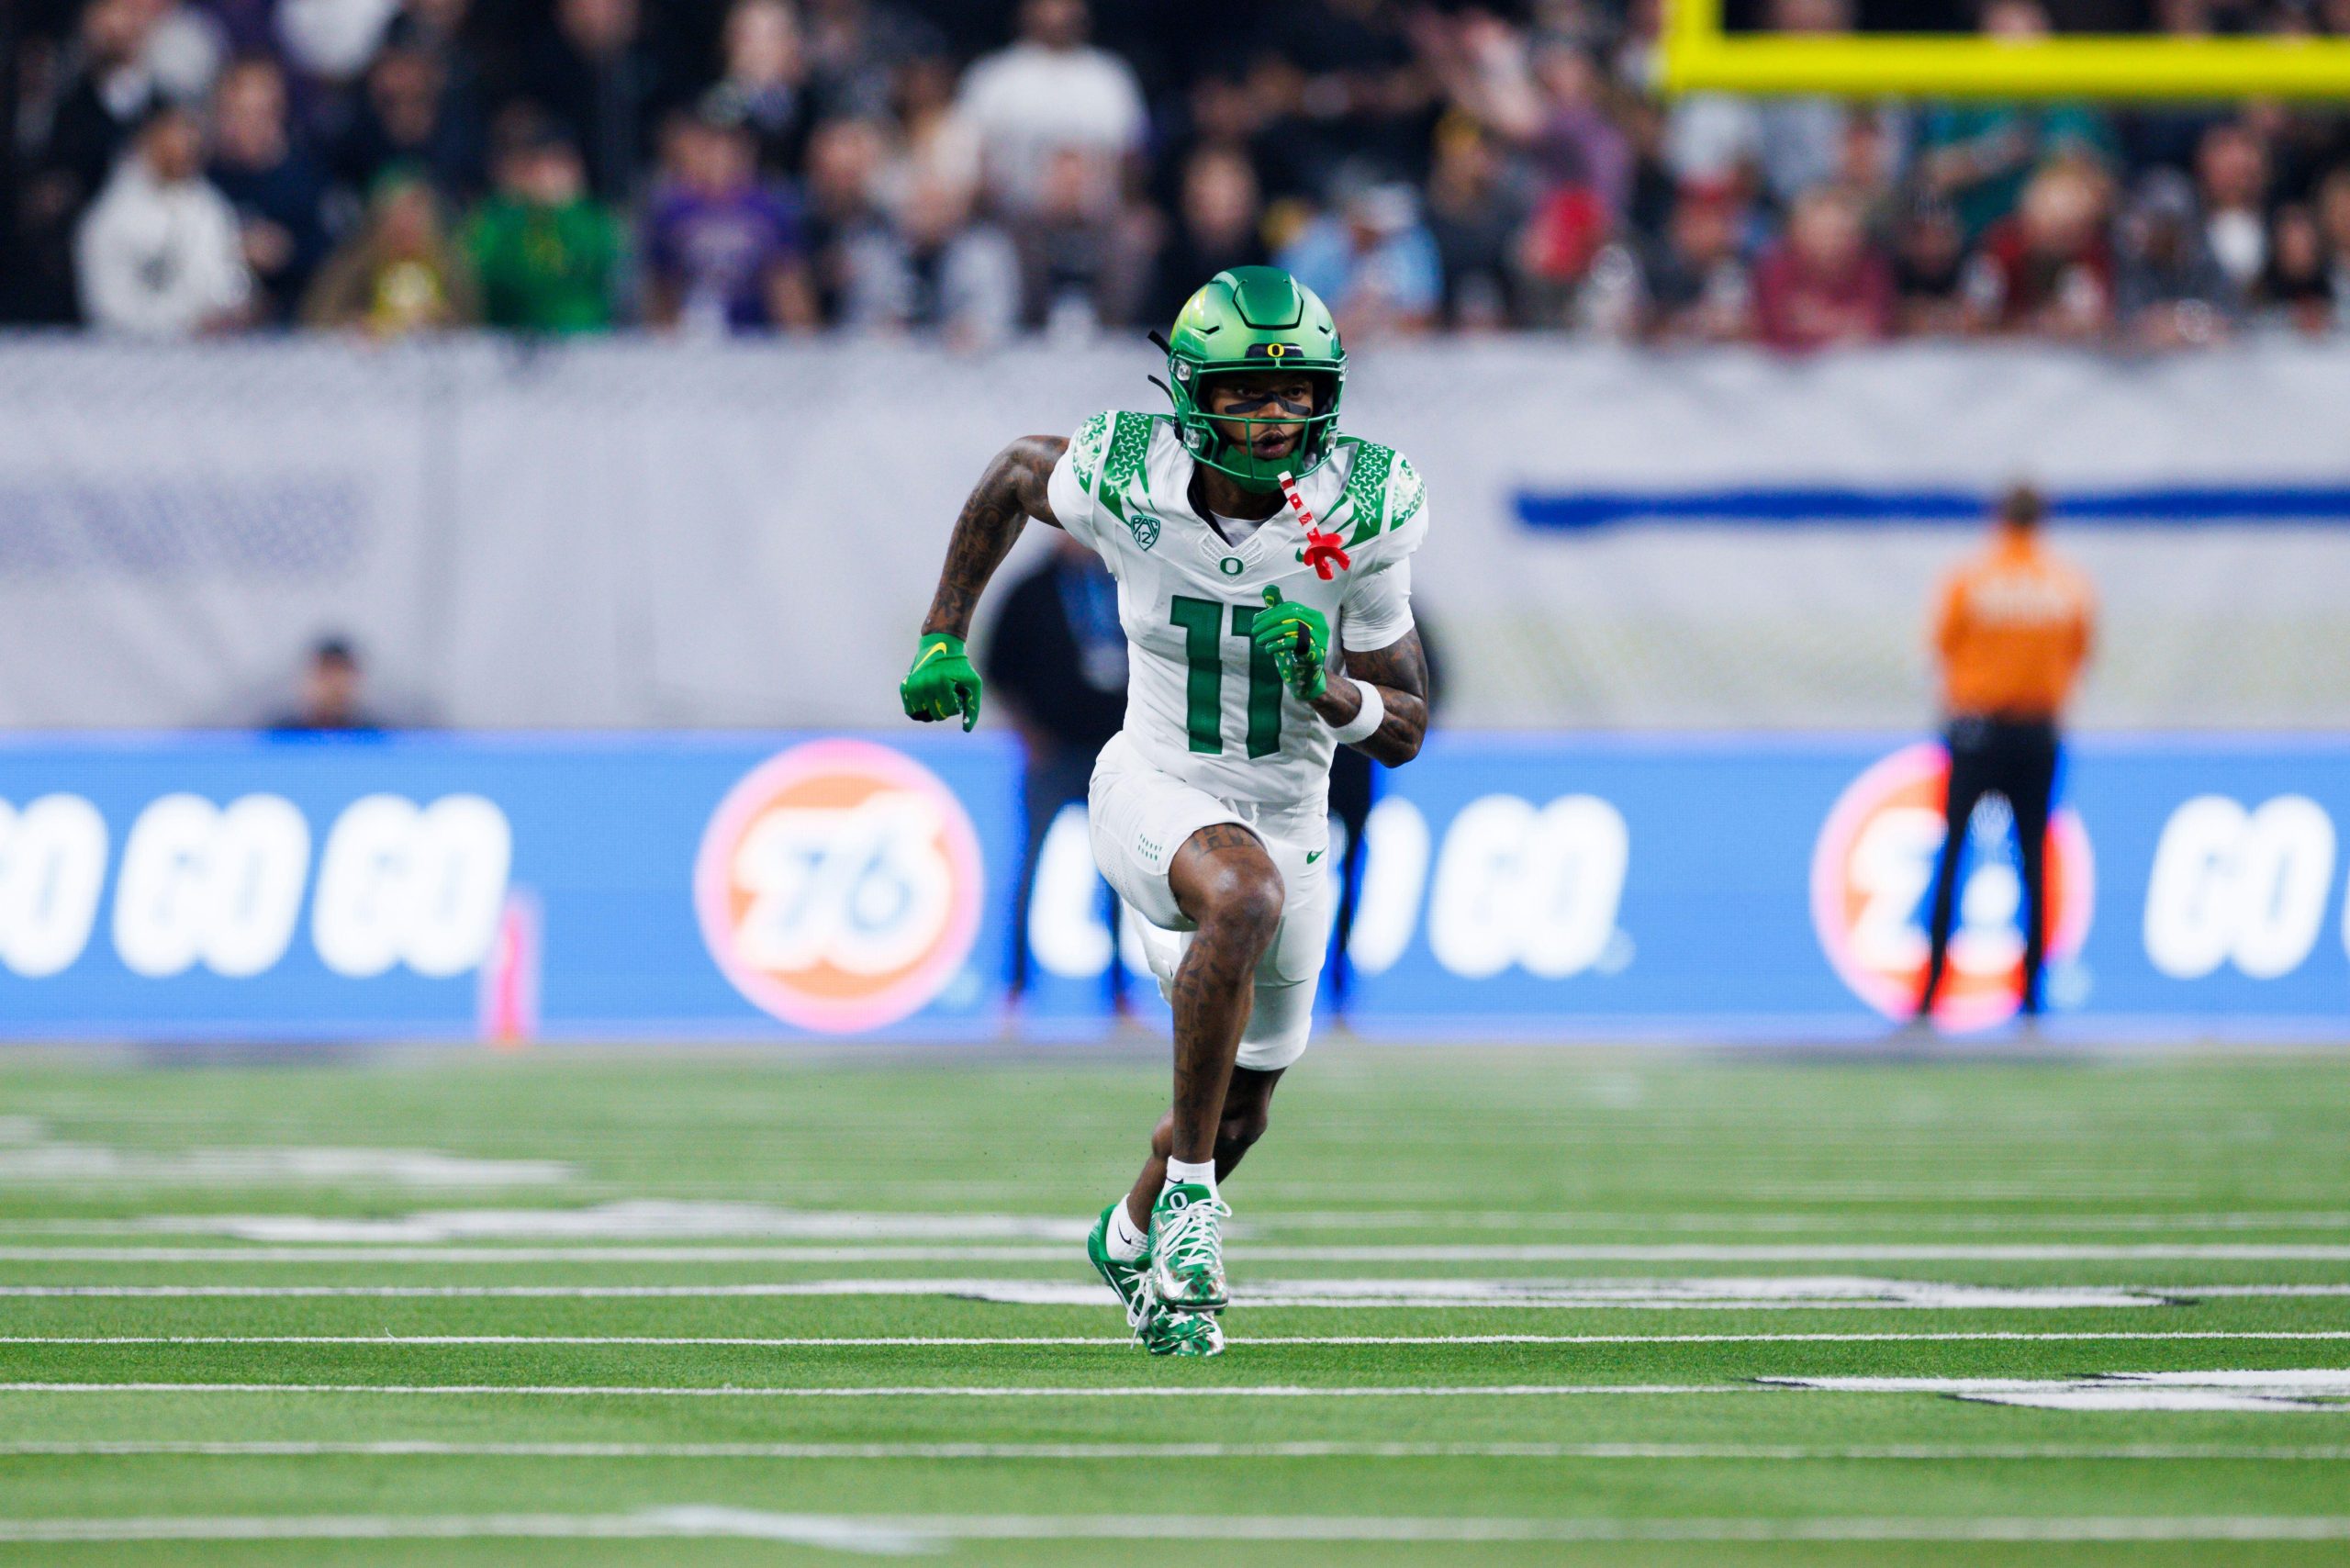
Kate Magdziuk breaks down the best and worst potential 2024 NFL Draft fits for fantasy football.
Wed, 24 Apr 24 10:00:49 +0000
Jon Macri reveals his 2024 NFL mock draft with a fantasy football slant.
Wed, 24 Apr 24 09:30:41 +0000
There is definitely a case to be made for why the Chargers should take an offensive tackle in Round 1, but some of the benefits associated with that may not be seen right away, especially if that player has to switch sides as a rookie.
Tue, 23 Apr 24 16:24:48 +0000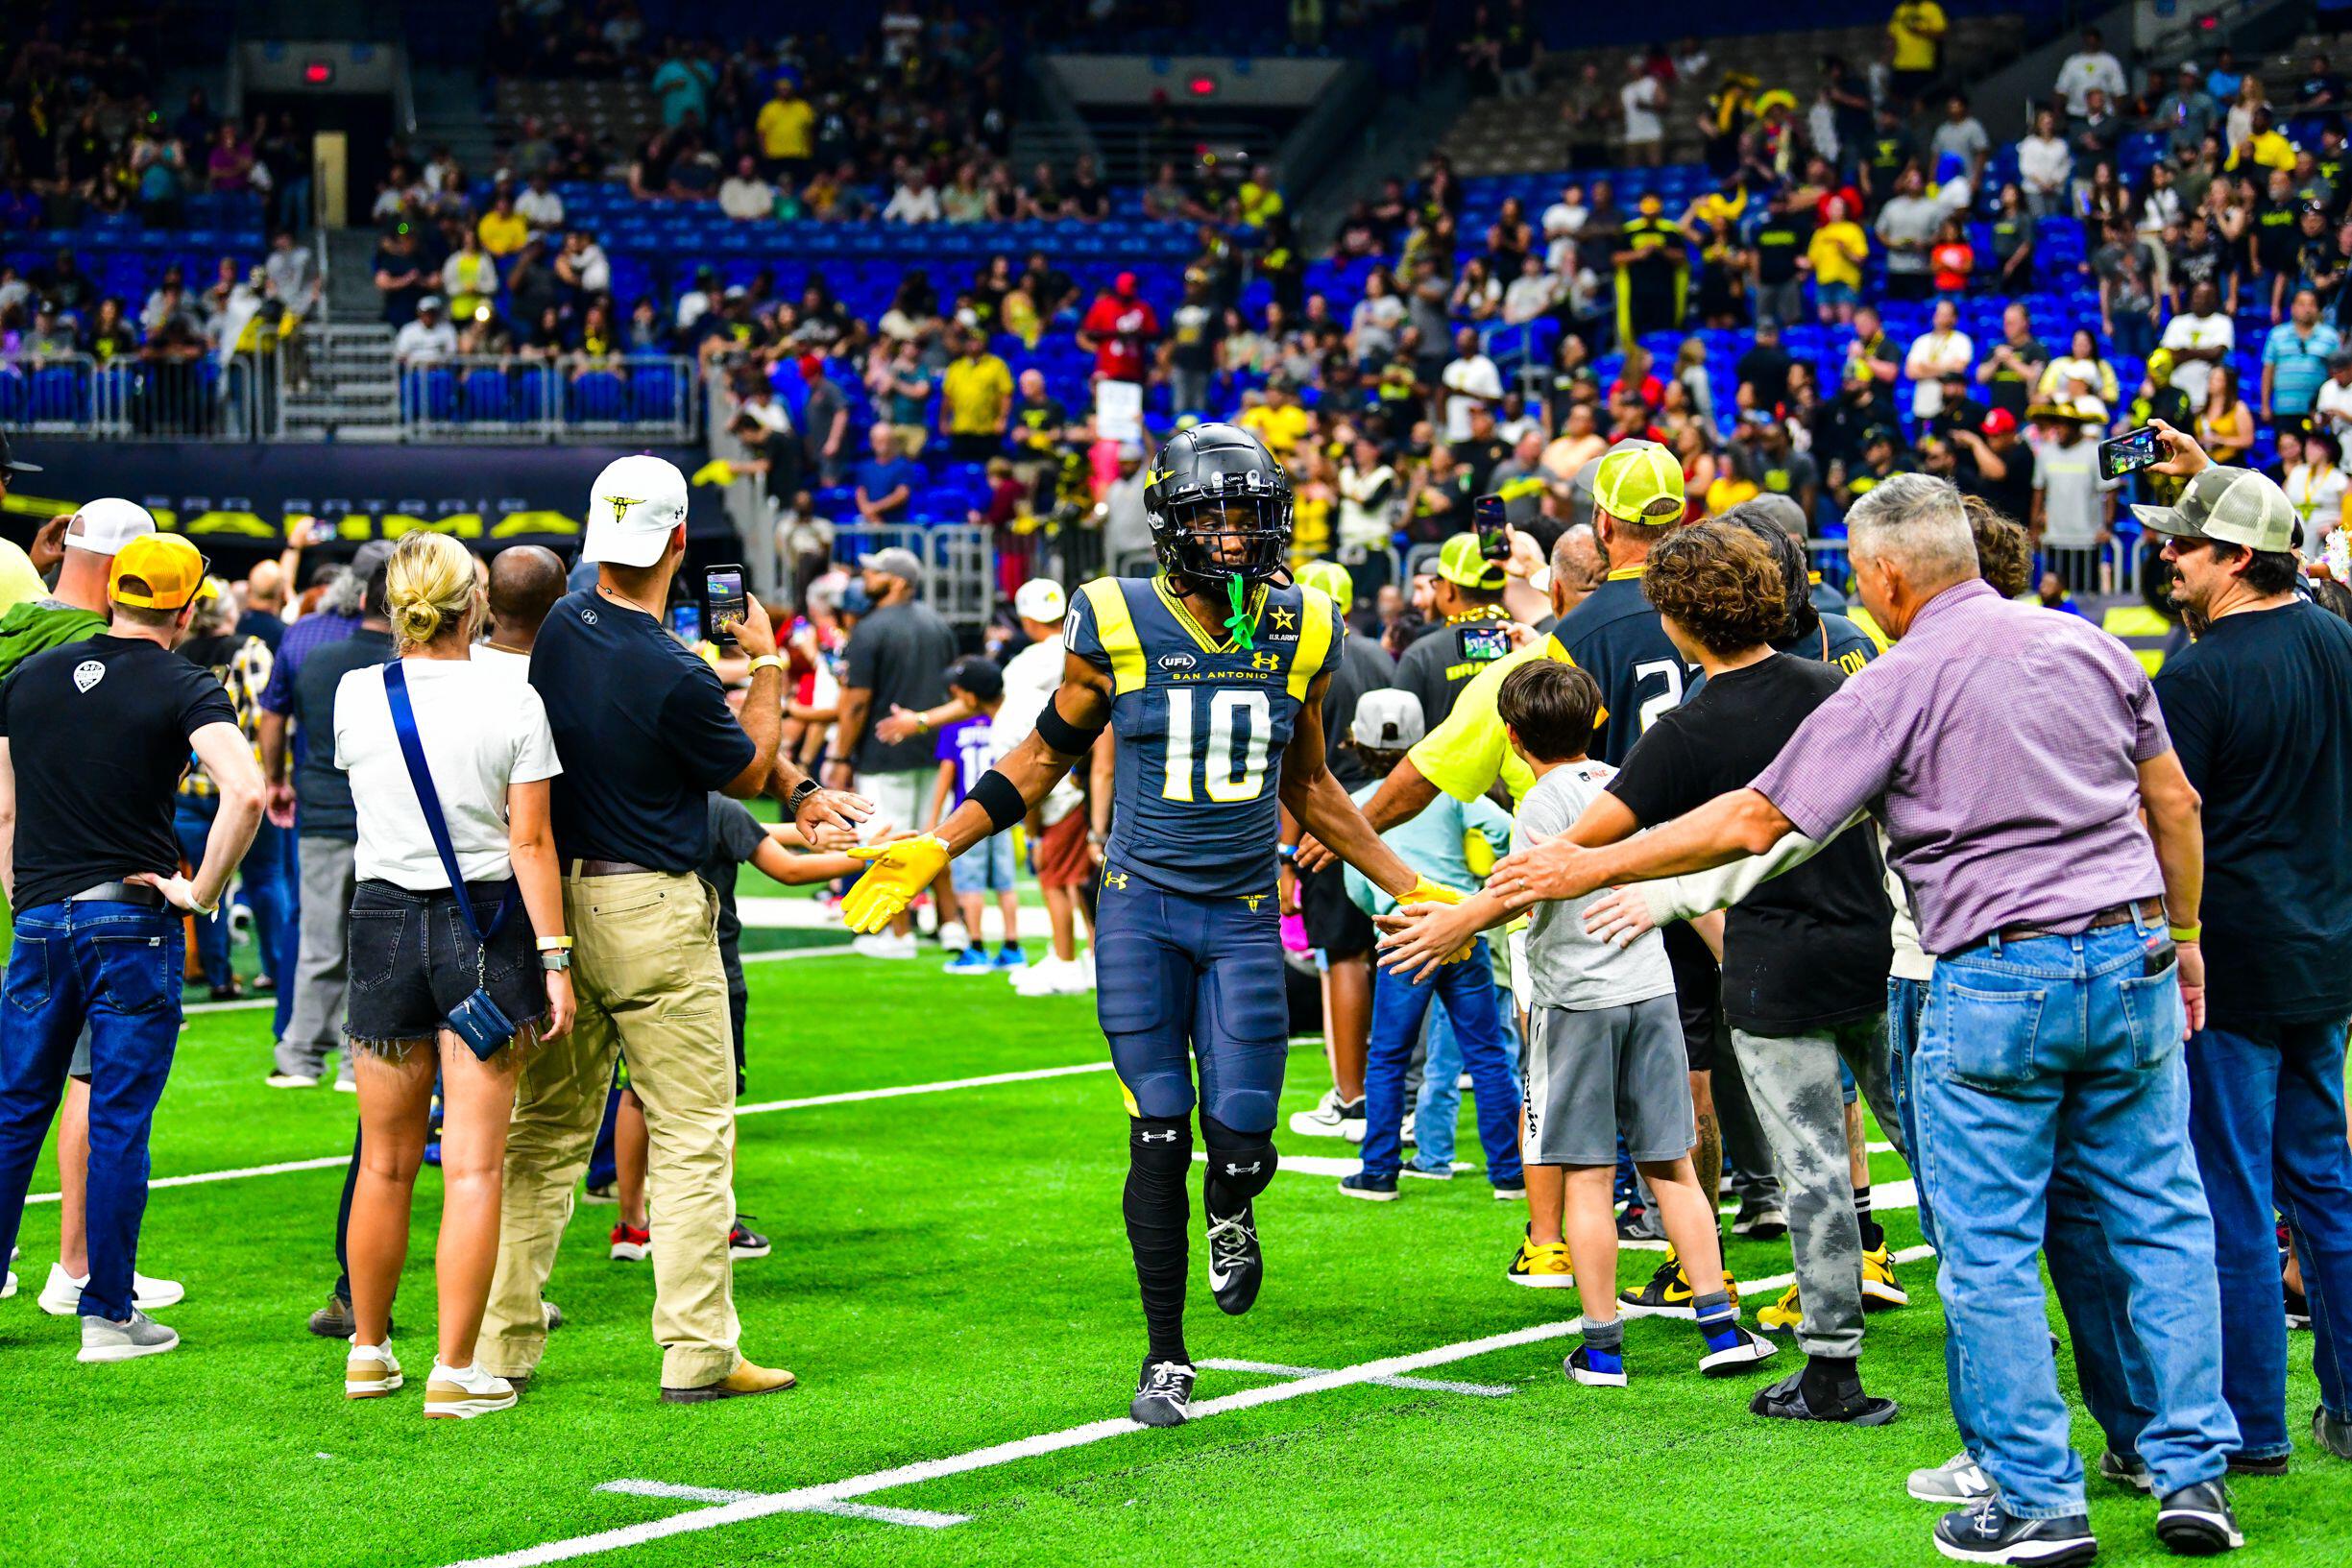
San Antonio Brahmas wide receiver Justin Smith and Memphis Showboats cornerback Quenton Meeks headline PFF's UFL Week 4 Team of the Week.
Tue, 23 Apr 24 15:30:12 +0000
Nic Bodiford reveals the 2024 NFL Draft prospects who produced the best after the catch.
Tue, 23 Apr 24 15:11:17 +0000
From Caleb Williams' top-tier arm talent to Marvin Harrison Jr.'s releases off the line of scrimmage, here are the strengths and weaknesses of PFF's top 50 draft prospects.
Tue, 23 Apr 24 14:15:42 +0000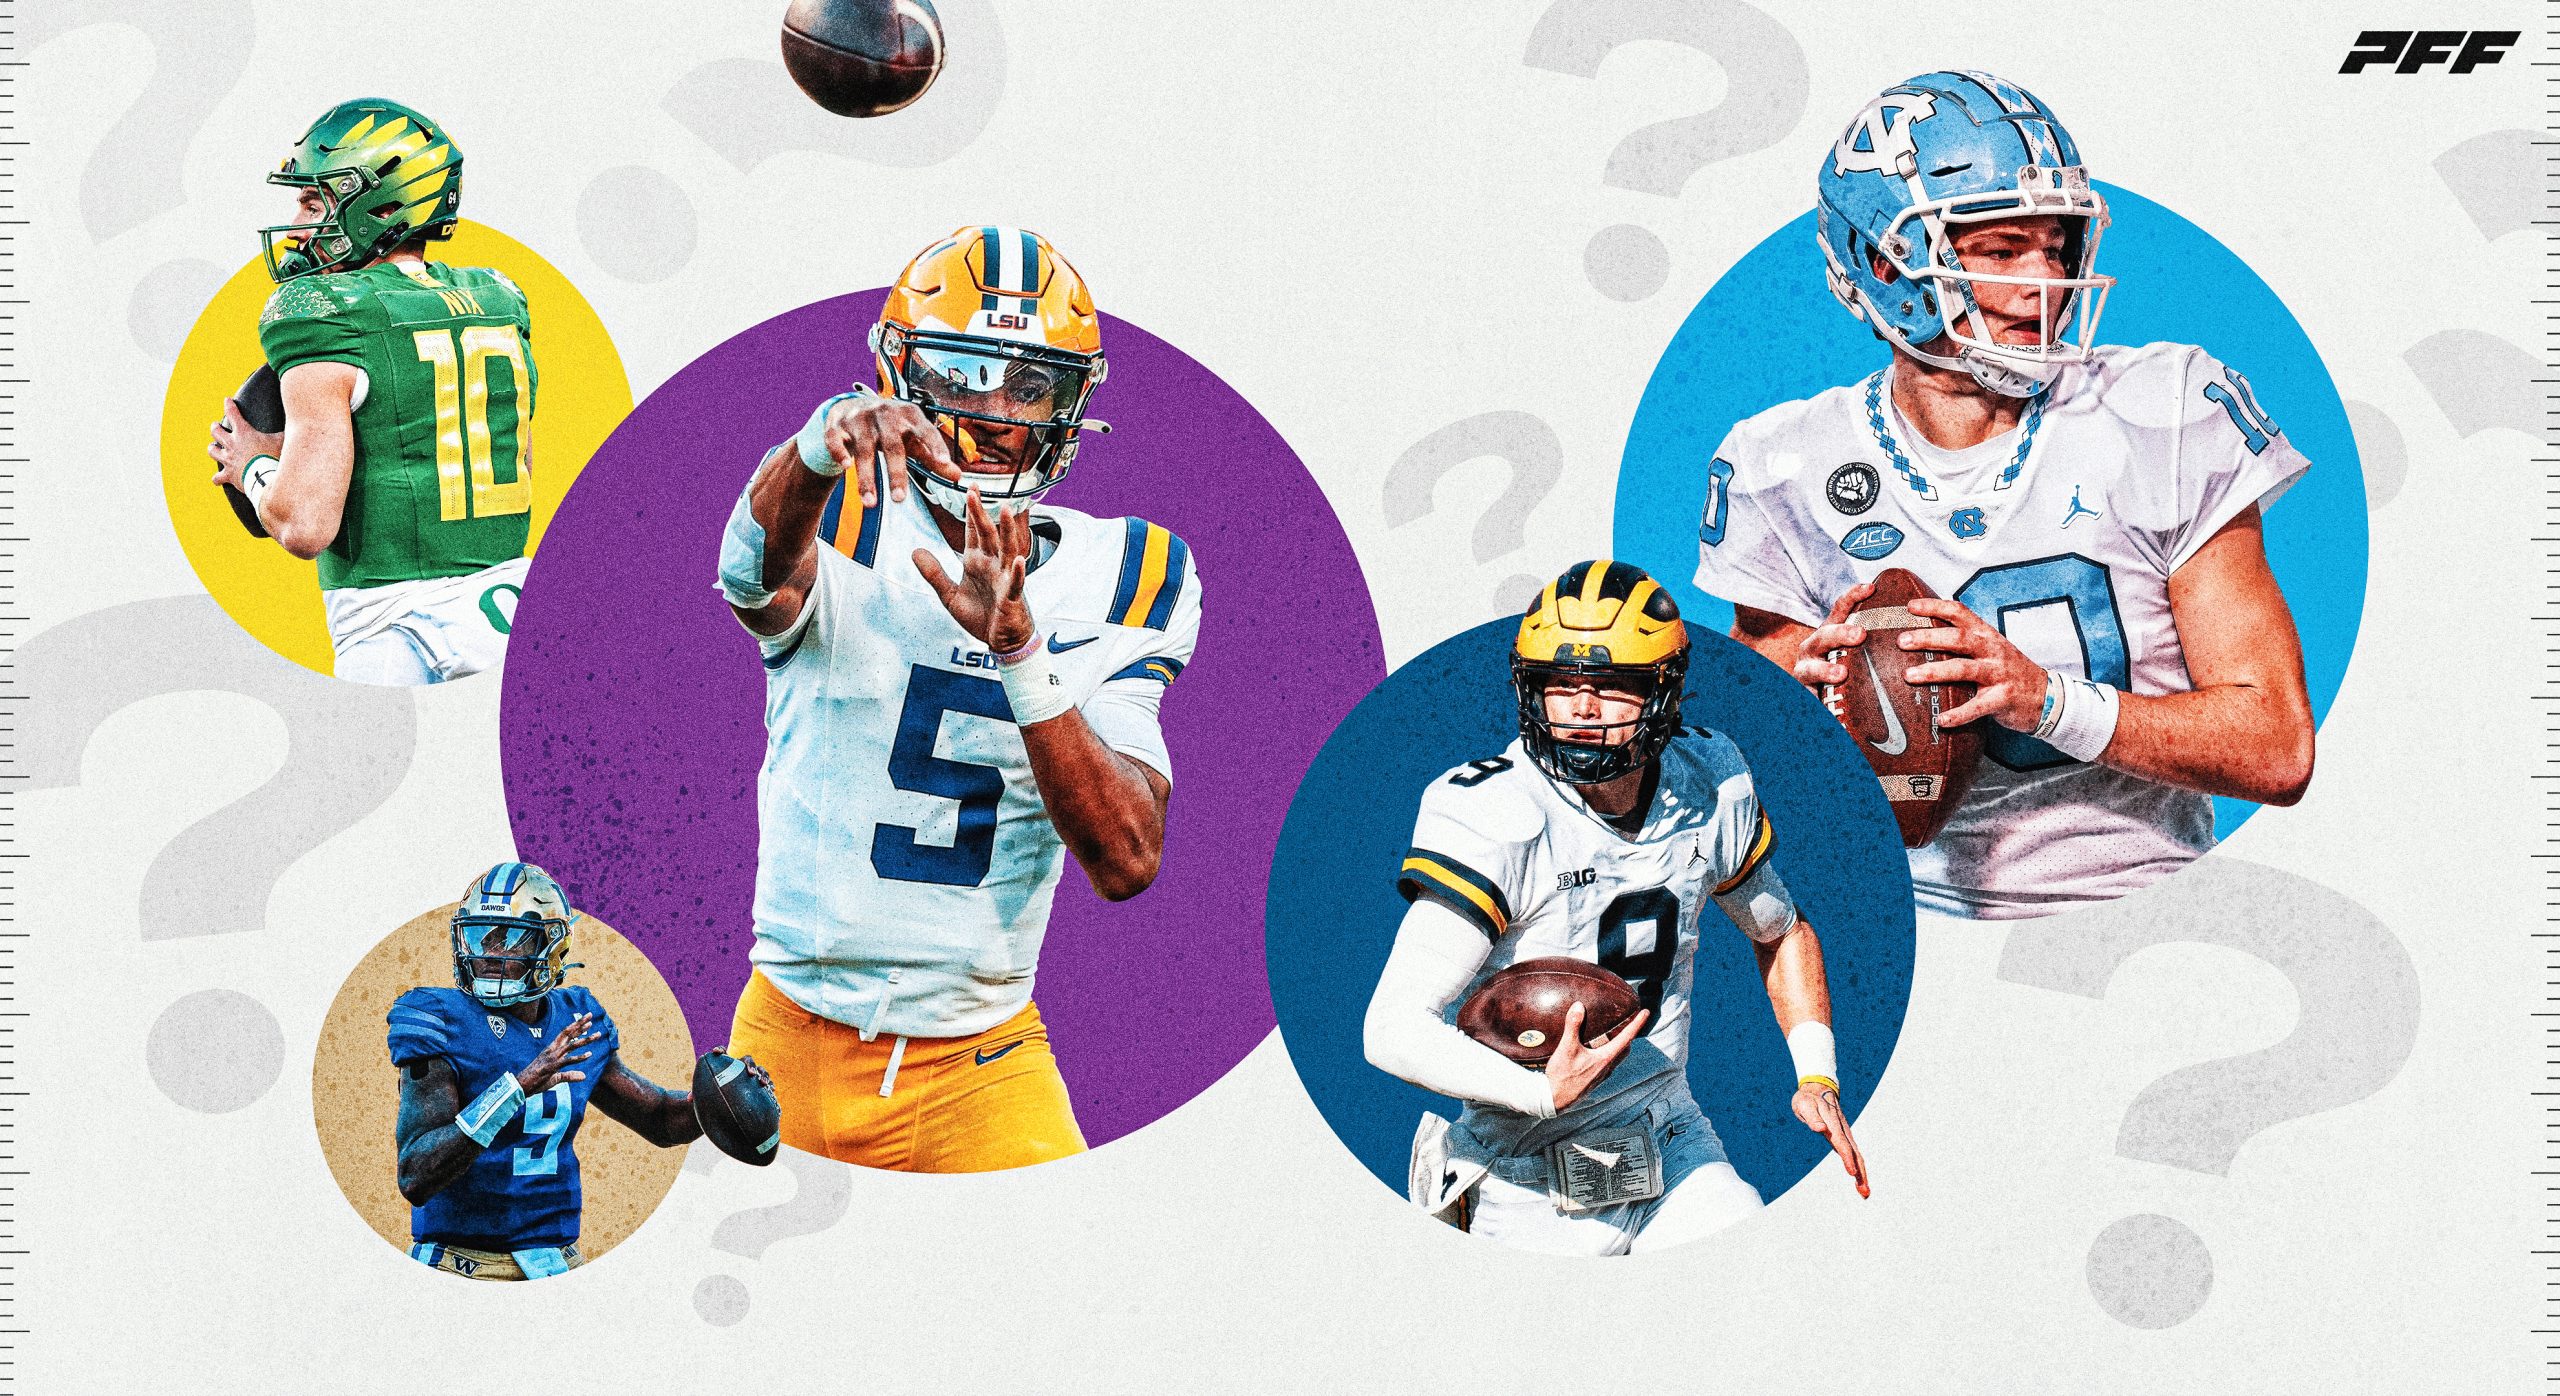
Six quarterbacks have a shot at going in the first round of the 2024 NFL Draft, and they each have questions to answer.
Tue, 23 Apr 24 13:15:42 +0000
We dive into how the final PFF big board, which features 316 players, differs from the consensus board compiled by Arif Hasan.
Tue, 23 Apr 24 12:45:51 +0000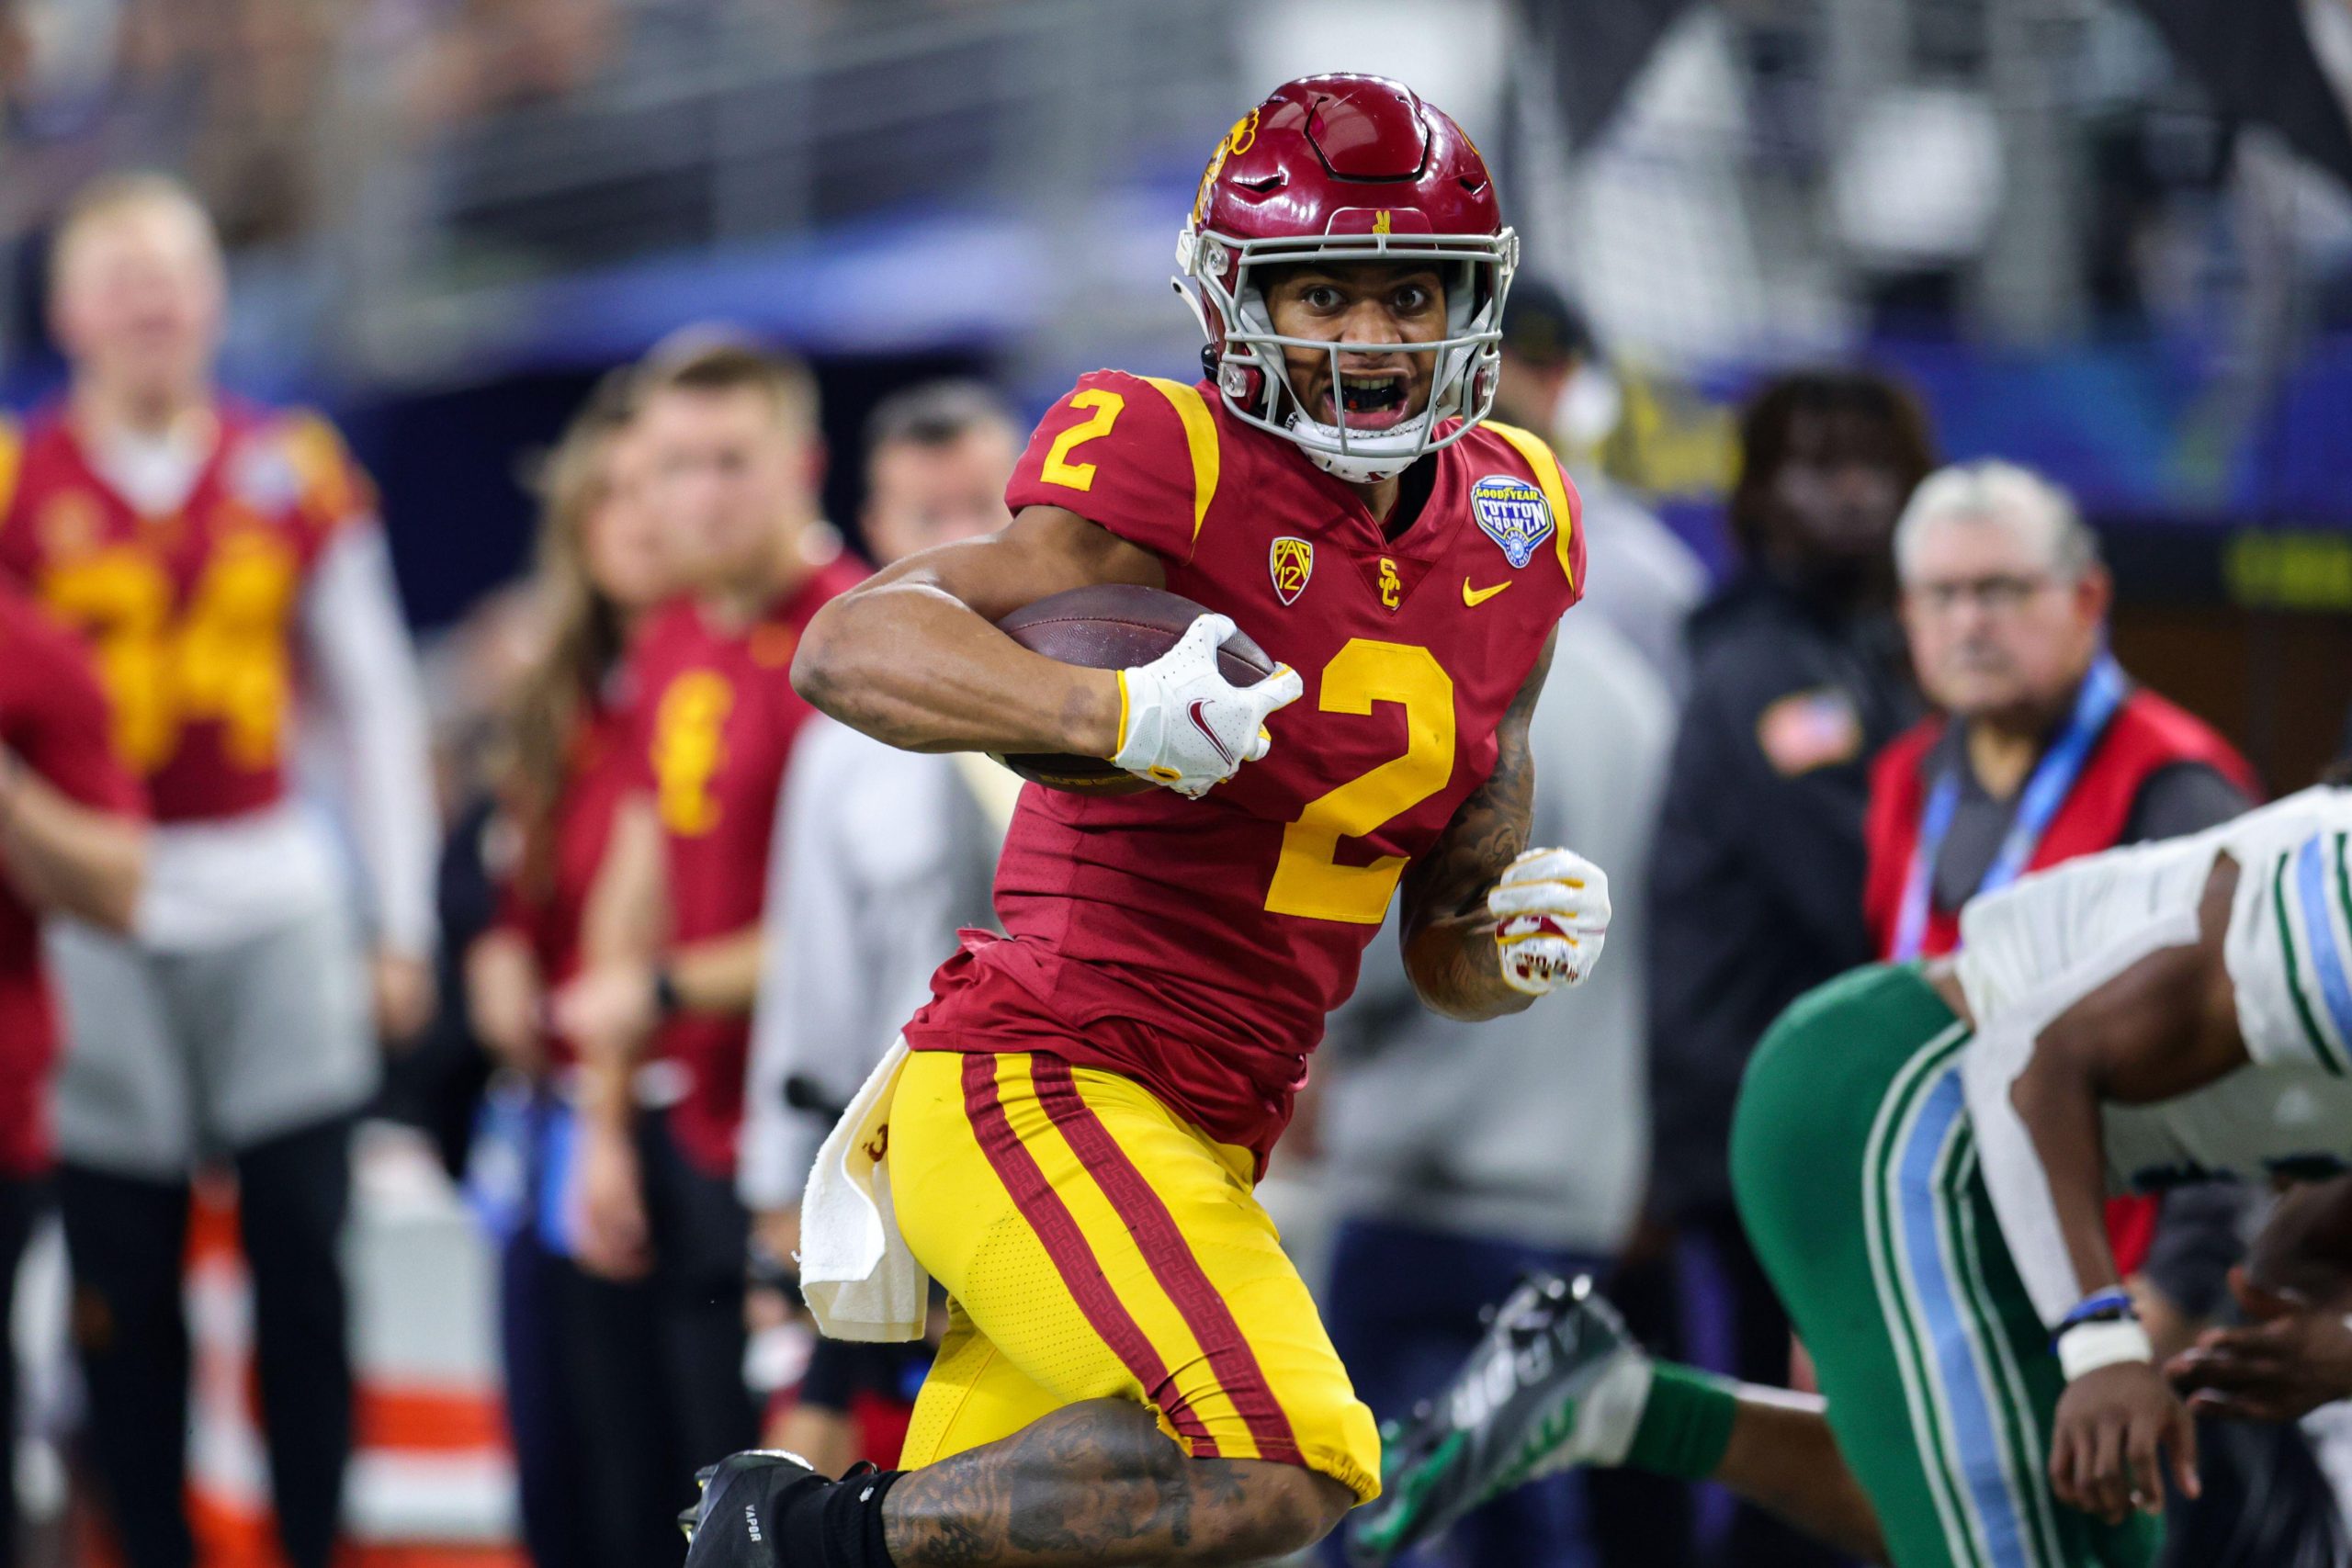
With the 2024 NFL Draft just days away, these are some of the best mid-round options to target if your team were to miss on a top-ranked draft prospect.
Tue, 23 Apr 24 12:30:52 +0000
These 2024 NFL Draft team-prospect pairings, while not always realistic based on draft slots, make sense for both parties.
Tue, 23 Apr 24 11:45:31 +0000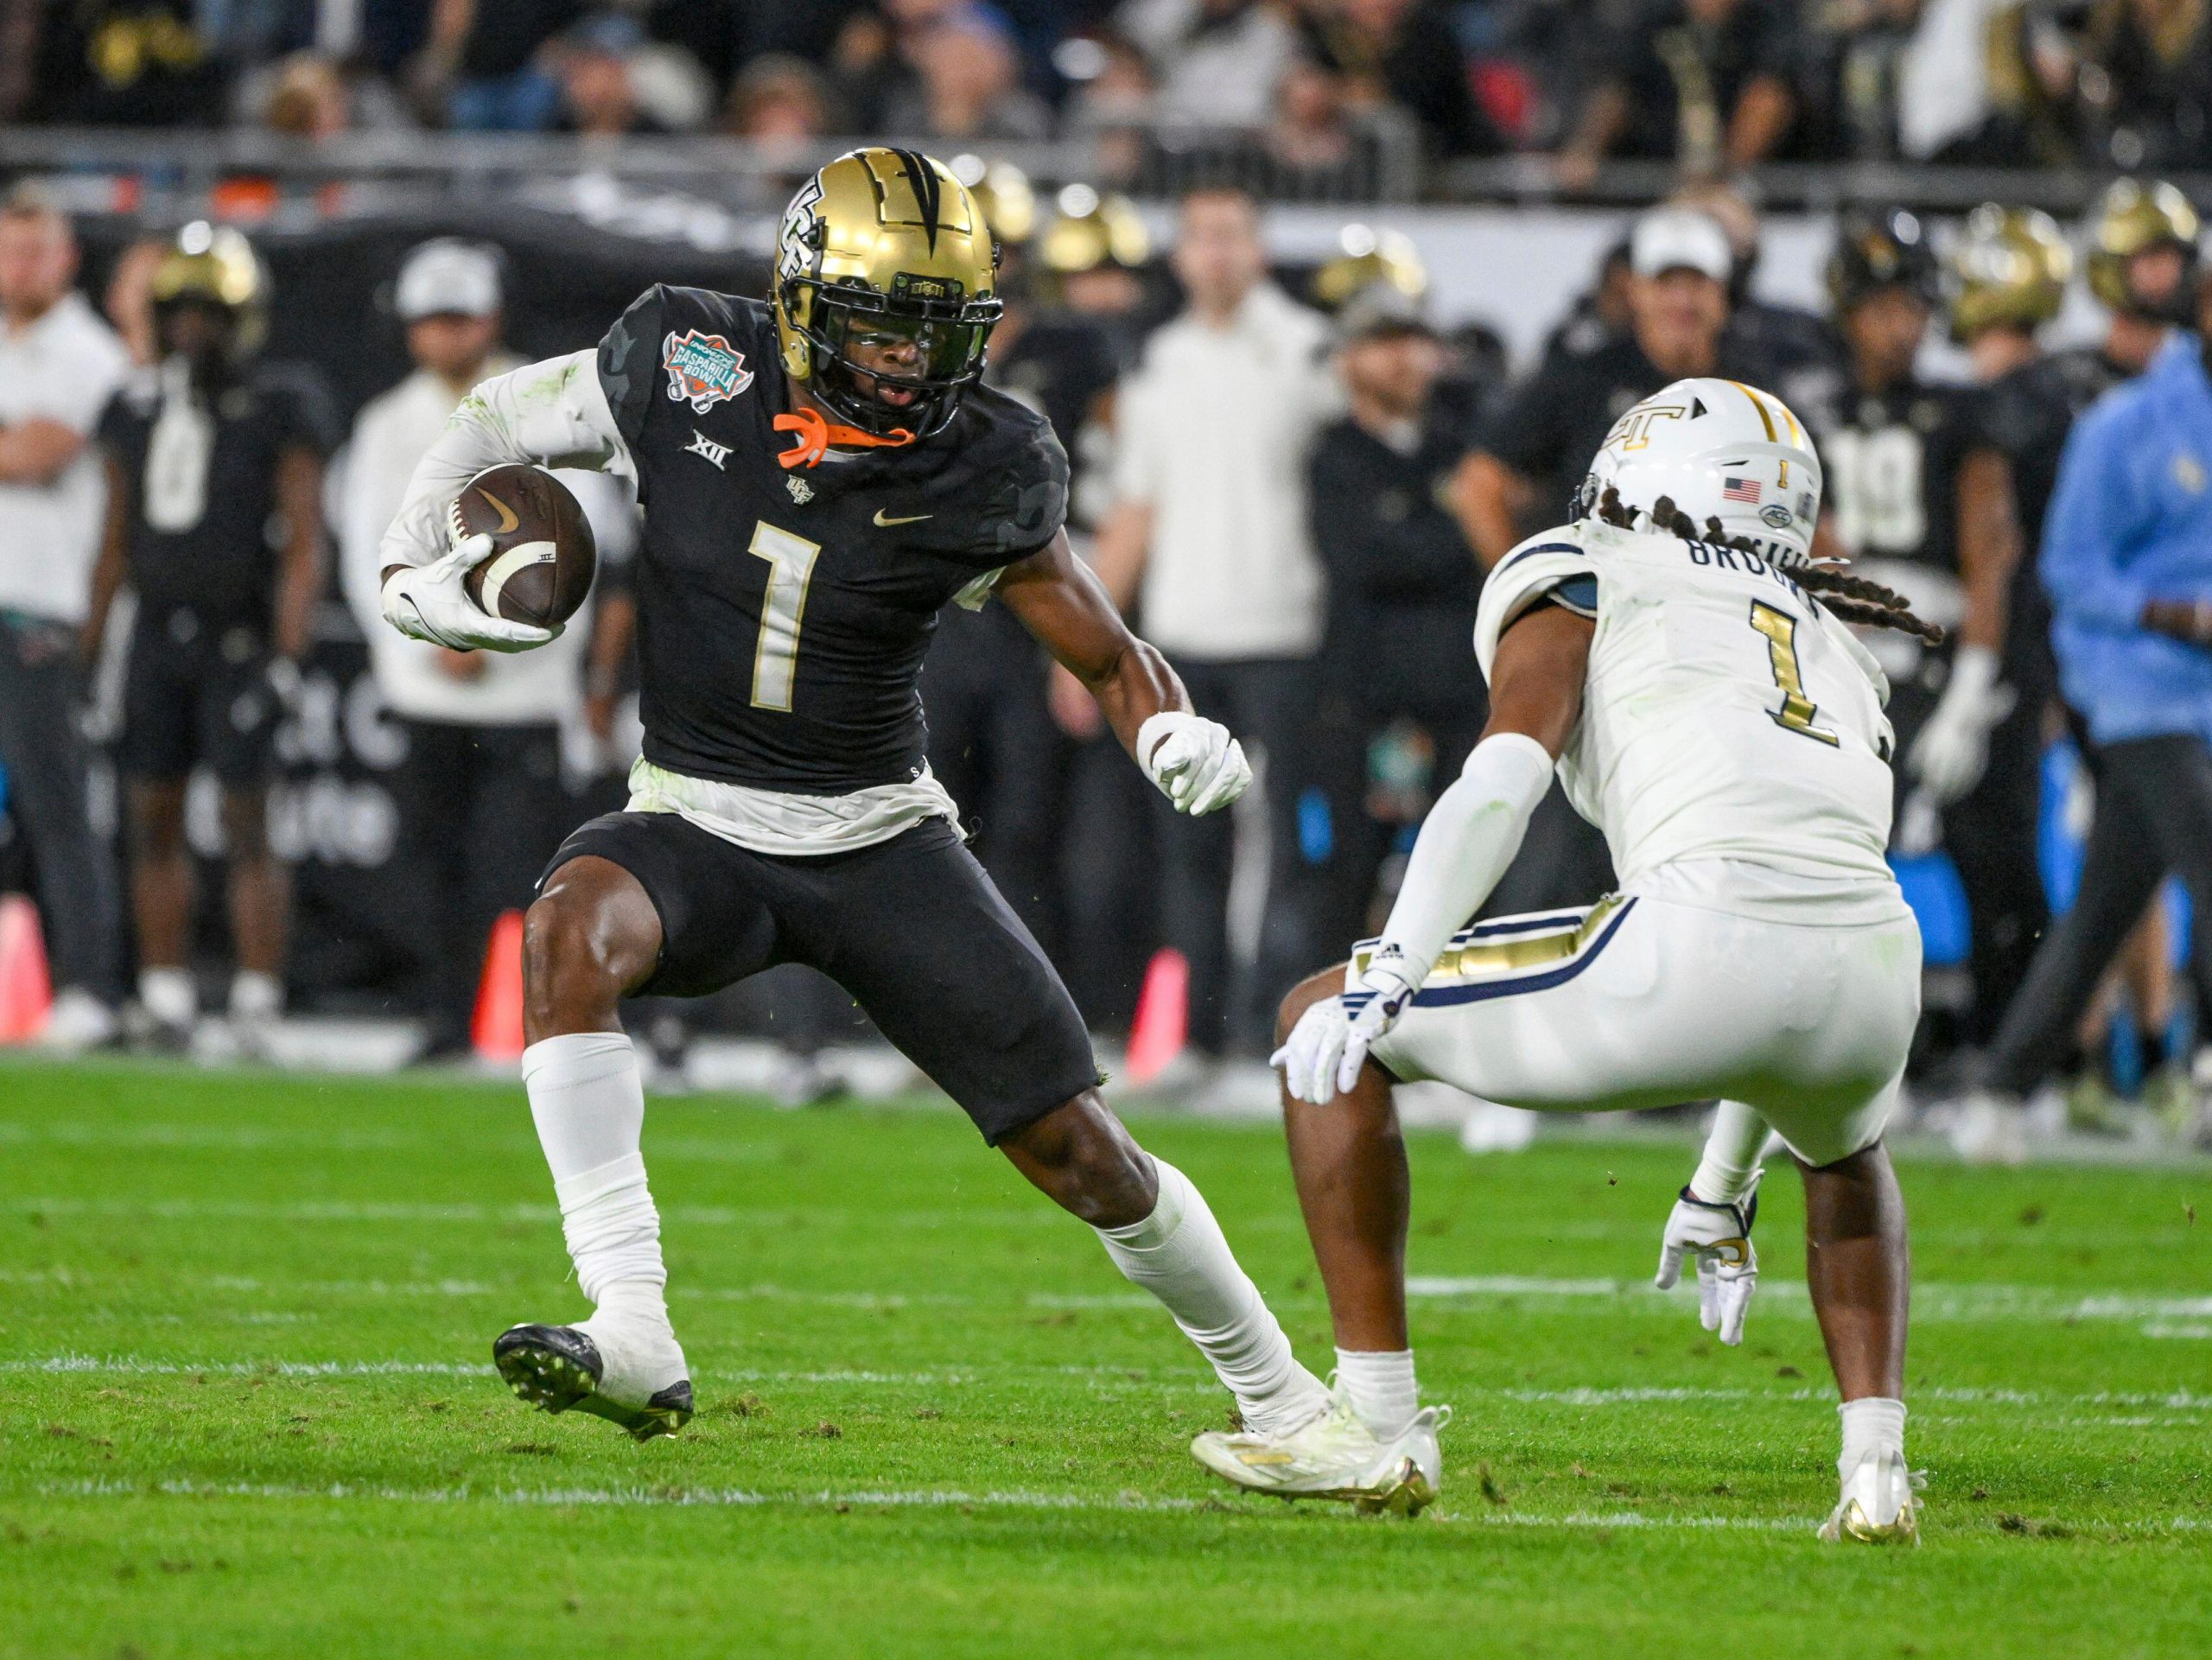
Jon Macri breaks down the 2024 pre-draft rookie sleepers in fantasy football.
Tue, 23 Apr 24 11:45:11 +0000All Featured Tools
-
Our exclusive database, featuring the most in-depth collection of NFL player performance data.
Available with
PFF All News & Analysis
The latest football news, analysis, and rankings from PFF. Featuring data-driven rankings and stats for NFL, fantasy football, and the NFL Draft.
