All News & Analysis

Over at PFF's live draft tracker, we analyzed every single pick in real time and gave a grade for each selection. Here is a quick recap of all those instant-reaction thoughts for each Day 3 pick.
Sat, 27 Apr 24 23:59:18 +0000
PFF grades all 32 teams' 2024 NFL Draft classes after three days and seven rounds of selections.
Sat, 27 Apr 24 23:25:24 +0000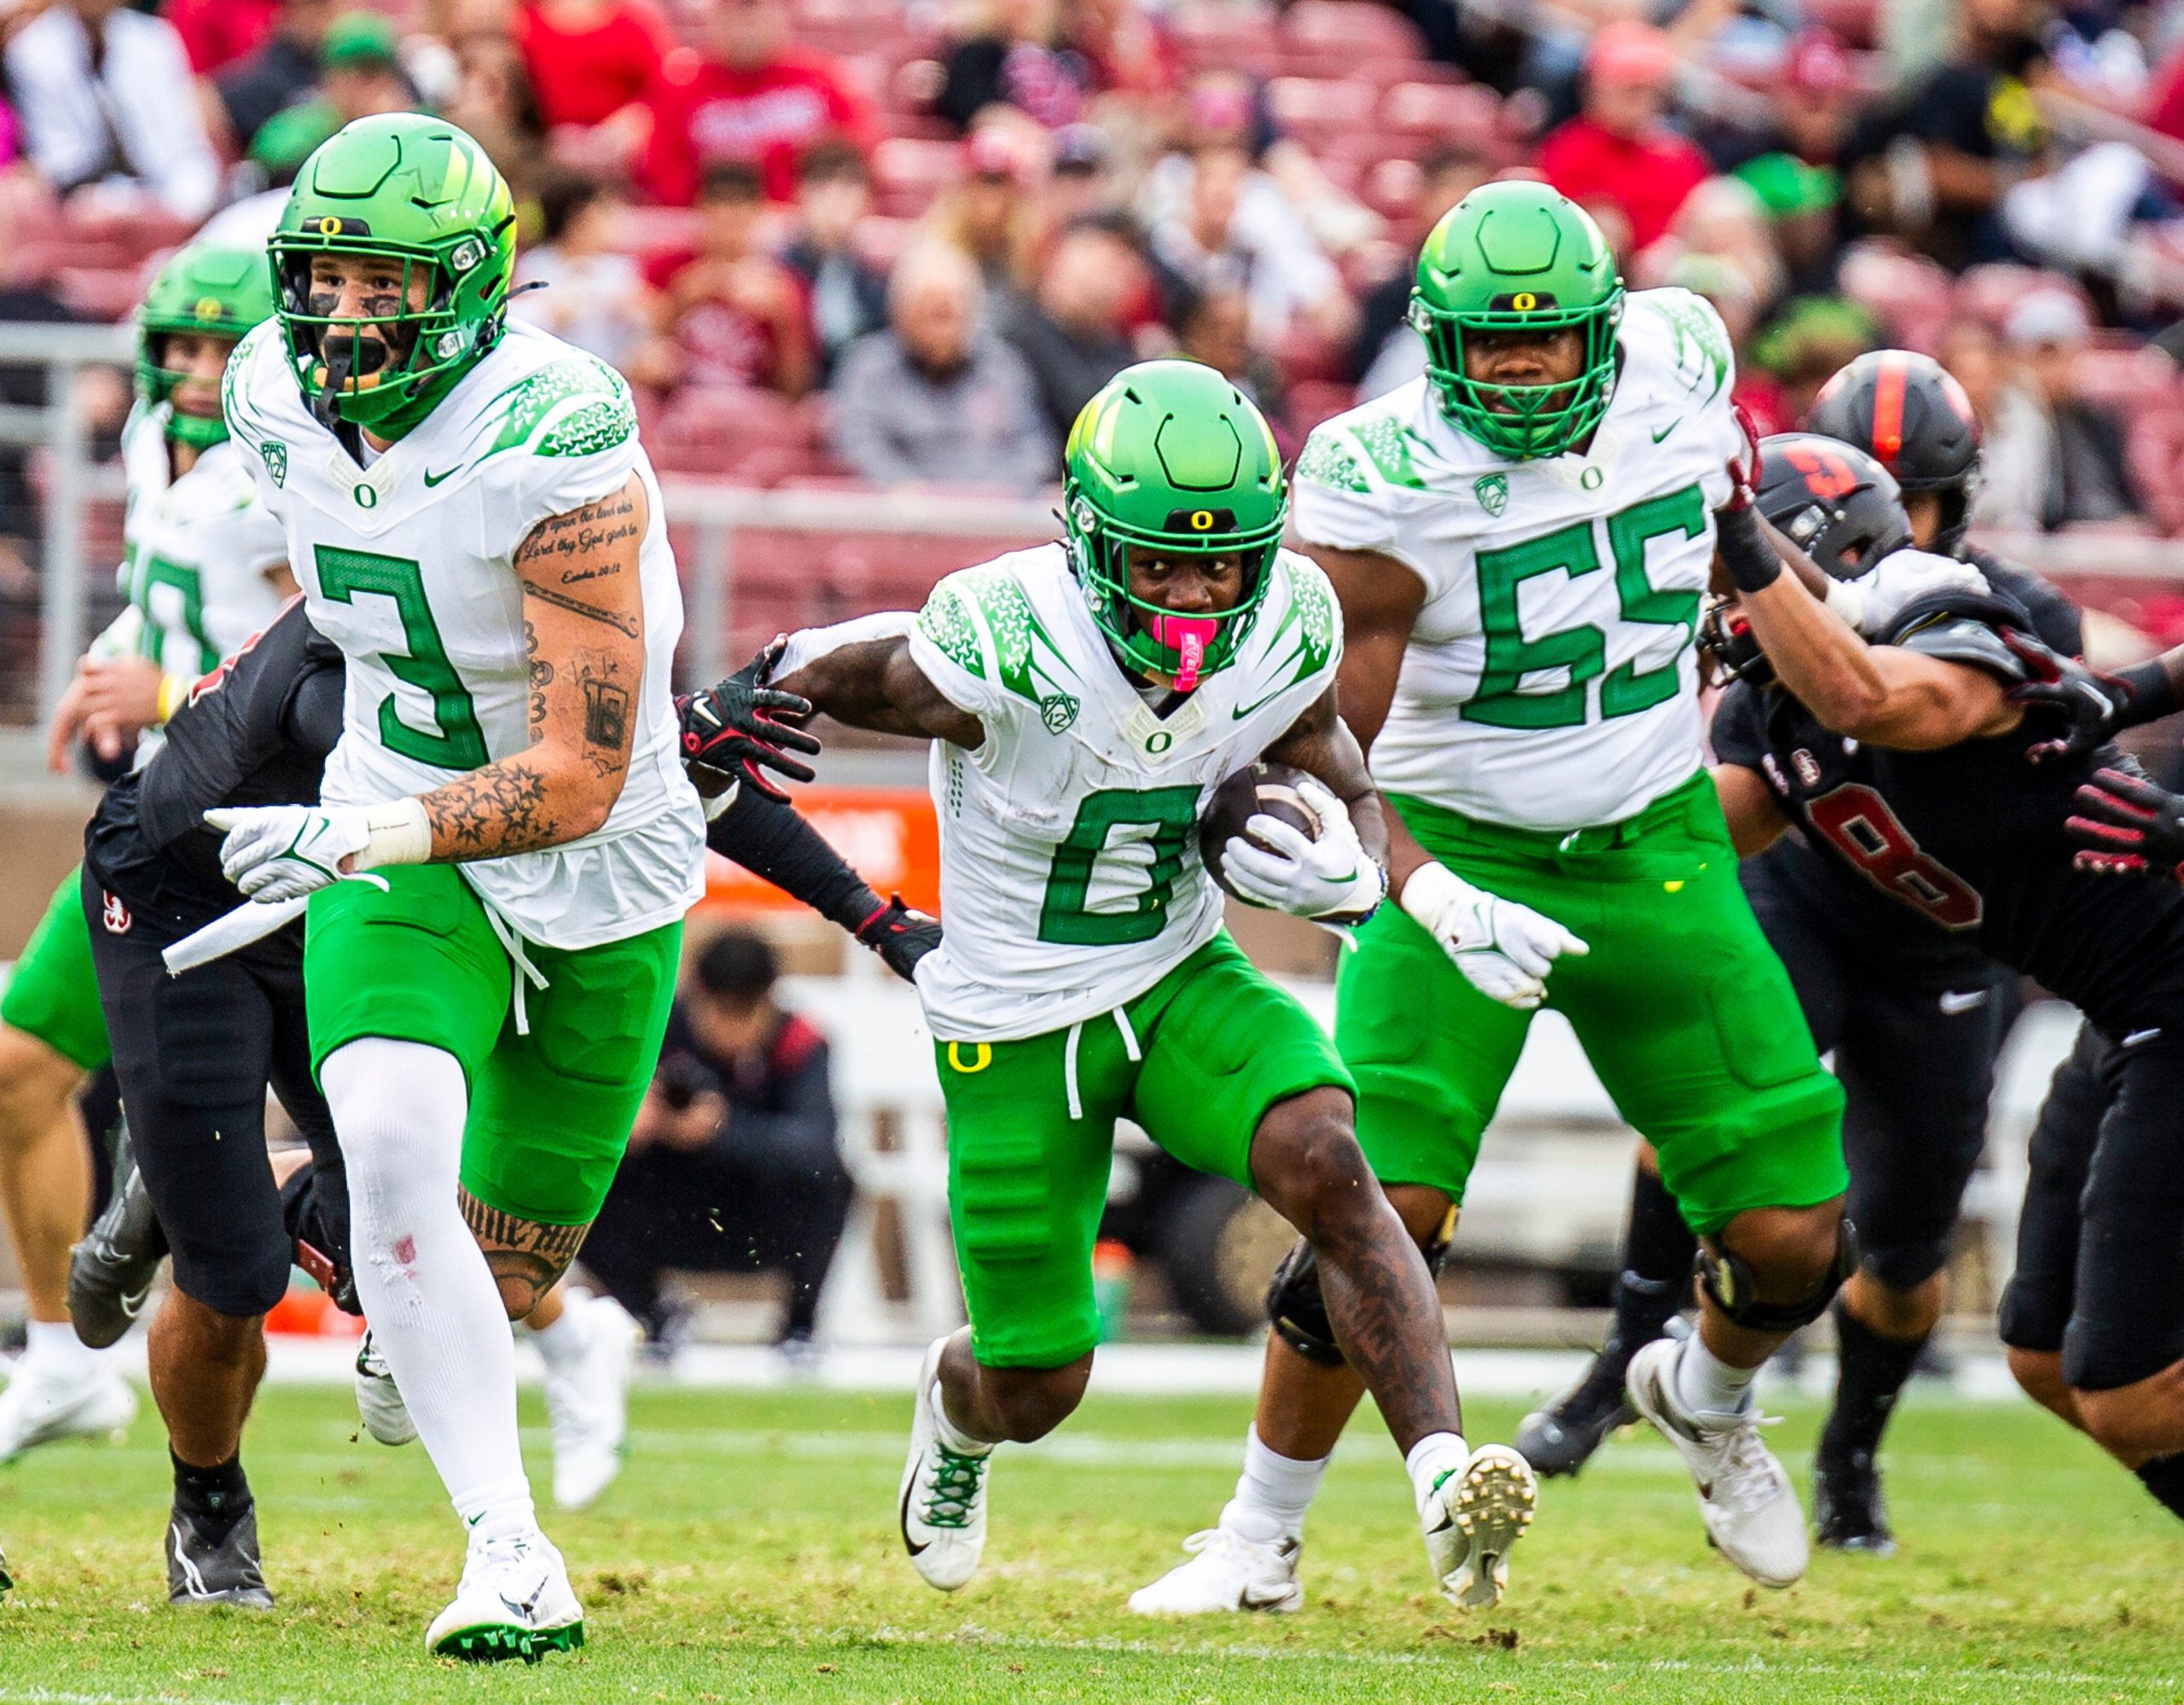
Nathan Jahnke breaks down the fantasy football winners and losers after Day 3 of the 2024 NFL Draft.
Sat, 27 Apr 24 22:45:32 +0000
Max Chadwick reveals his big board for the 2025 NFL Draft.
Sat, 27 Apr 24 22:36:56 +0000
The best available prospects are pulled from PFF’s final big board and will be updated throughout the 2024 NFL Draft.
Sat, 27 Apr 24 15:20:28 +0000
NFL teams will look to address their remaining roster needs with the top talents who remain on the board ahead of Day 3 of the 2024 NFL Draft.
Sat, 27 Apr 24 14:41:46 +0000
The five best remaining players at every position, including Oregon wide receiver Troy Franklin.
Sat, 27 Apr 24 09:00:48 +0000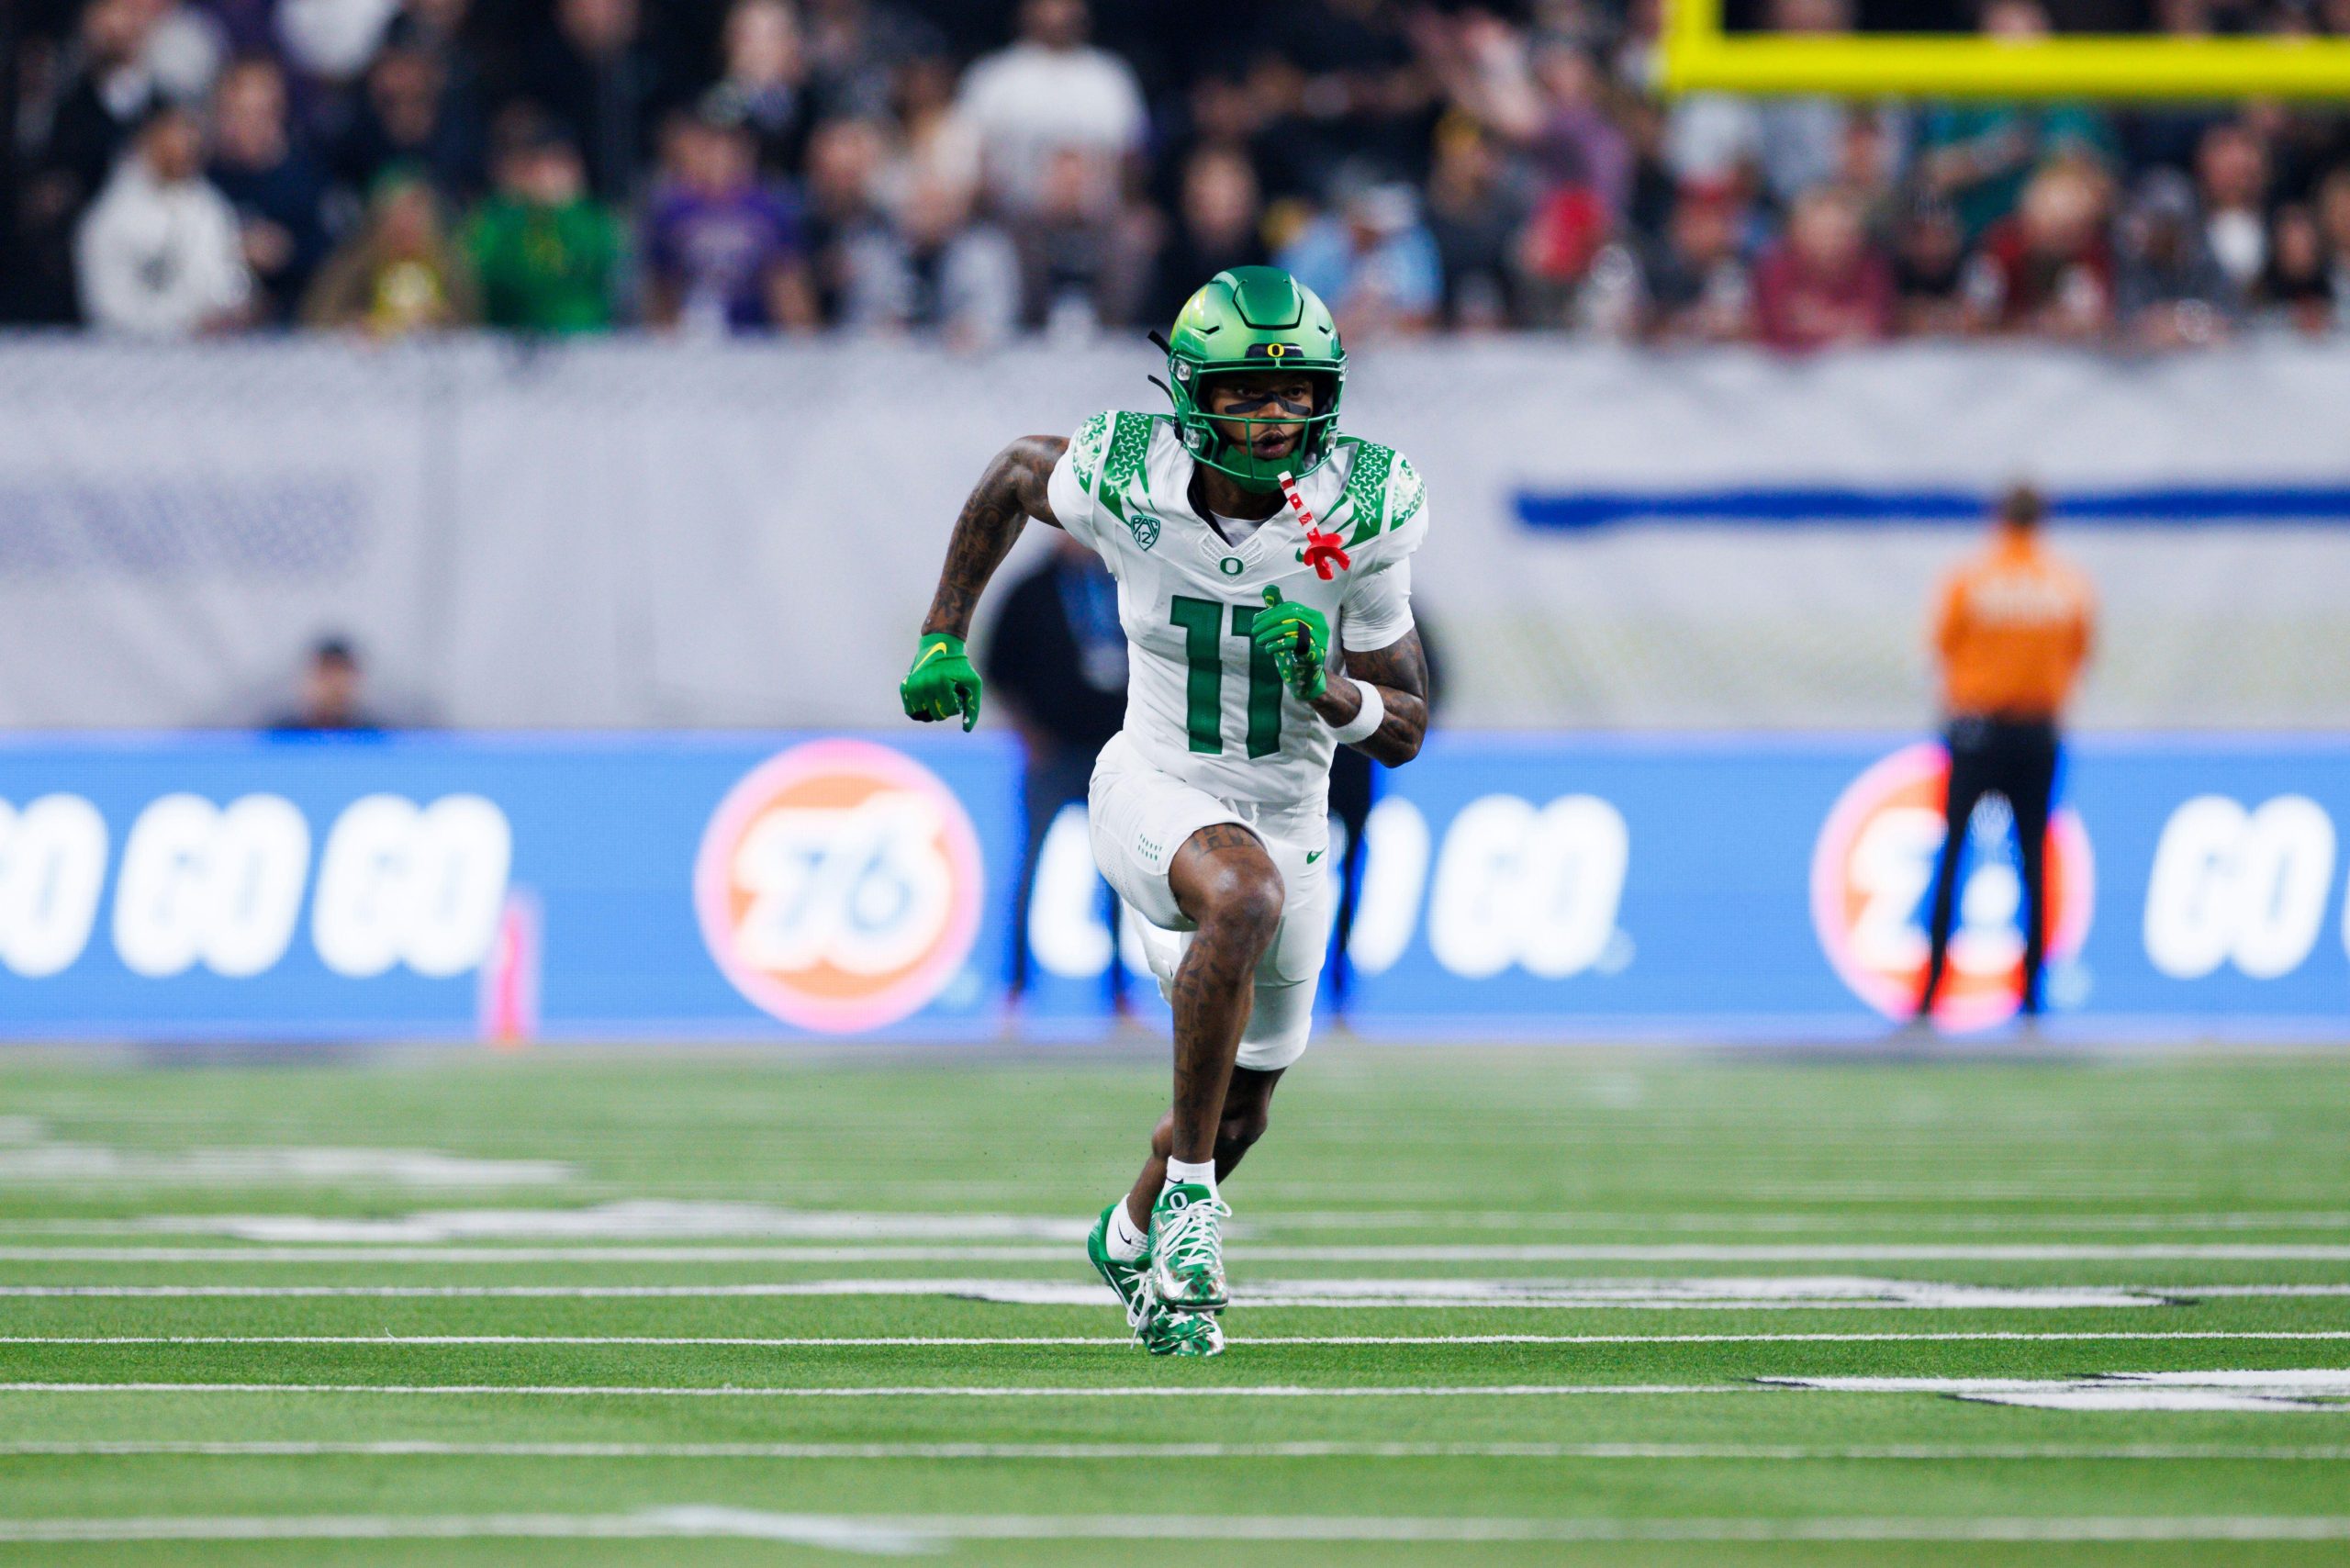
There’s just one day left in the 2024 NFL Draft, but before we flip mock drafts over to the 2025 cycle, there’s time for just one more 2024 mock draft -- just for all the sickos out there.
Sat, 27 Apr 24 05:08:10 +0000
Ryan Smith breaks down which teams are trending up and down after Rounds 2 and 3 of the 2024 NFL Draft.
Sat, 27 Apr 24 04:48:42 +0000
Every NFL draft features several players who get taken much earlier than anticipated, and Day 2 of the 2024 NFL Draft was no different.
Sat, 27 Apr 24 04:48:18 +0000
A number of first-round-caliber prospects fell out of the first round on Day 1, much to the benefit of teams such as the Washington Commanders and Pittsburgh Steelers.
Sat, 27 Apr 24 04:40:58 +0000
The Washington Commanders' defense and the Pittsburgh Steelers' offense are significantly improved after Day 2 of the 2024 NFL Draft.
Sat, 27 Apr 24 04:15:59 +0000
Over at PFF's live draft tracker, we analyzed every single pick in real time and gave a grade for each selection. Here is a quick recap of all those instant-reaction thoughts for each Day 2 pick.
Sat, 27 Apr 24 03:45:40 +0000
Nathan Jahnke reveals the fantasy football winners and losers from Day 2 in the 2024 NFL Draft.
Sat, 27 Apr 24 03:41:16 +0000
Ryan Smith breaks down which teams are trending up and down after Round 1 of the 2024 NFL Draft.
Fri, 26 Apr 24 14:20:58 +0000
Nic Bodiford breaks down the best role players in the 2024 NFL Draft.
Fri, 26 Apr 24 14:09:03 +0000
We hand out team grades for all five trades that went down in the first round of the 2024 NFL Draft.
Fri, 26 Apr 24 14:00:39 +0000
NFL teams will look to address their remaining roster needs with the top talents who remain on the board ahead of Day 2 of the 2024 NFL Draft.
Fri, 26 Apr 24 12:45:32 +0000
The five best remaining players at every position, including Iowa CB Cooper DeJean.
Fri, 26 Apr 24 06:35:57 +0000
Every NFL draft features several players who get taken much earlier than anticipated, and Round 1 of the 2024 NFL Draft was no different.
Fri, 26 Apr 24 05:48:41 +0000All Featured Tools
-
Our exclusive database, featuring the most in-depth collection of NFL player performance data.
Available with
PFF All News & Analysis
The latest football news, analysis, and rankings from PFF. Featuring data-driven rankings and stats for NFL, fantasy football, and the NFL Draft.
