All News & Analysis

Ryan Smith breaks down which teams are trending up and down after Round 1 of the 2024 NFL Draft.
Fri, 26 Apr 24 14:20:58 +0000
Nic Bodiford breaks down the best role players in the 2024 NFL Draft.
Fri, 26 Apr 24 14:09:03 +0000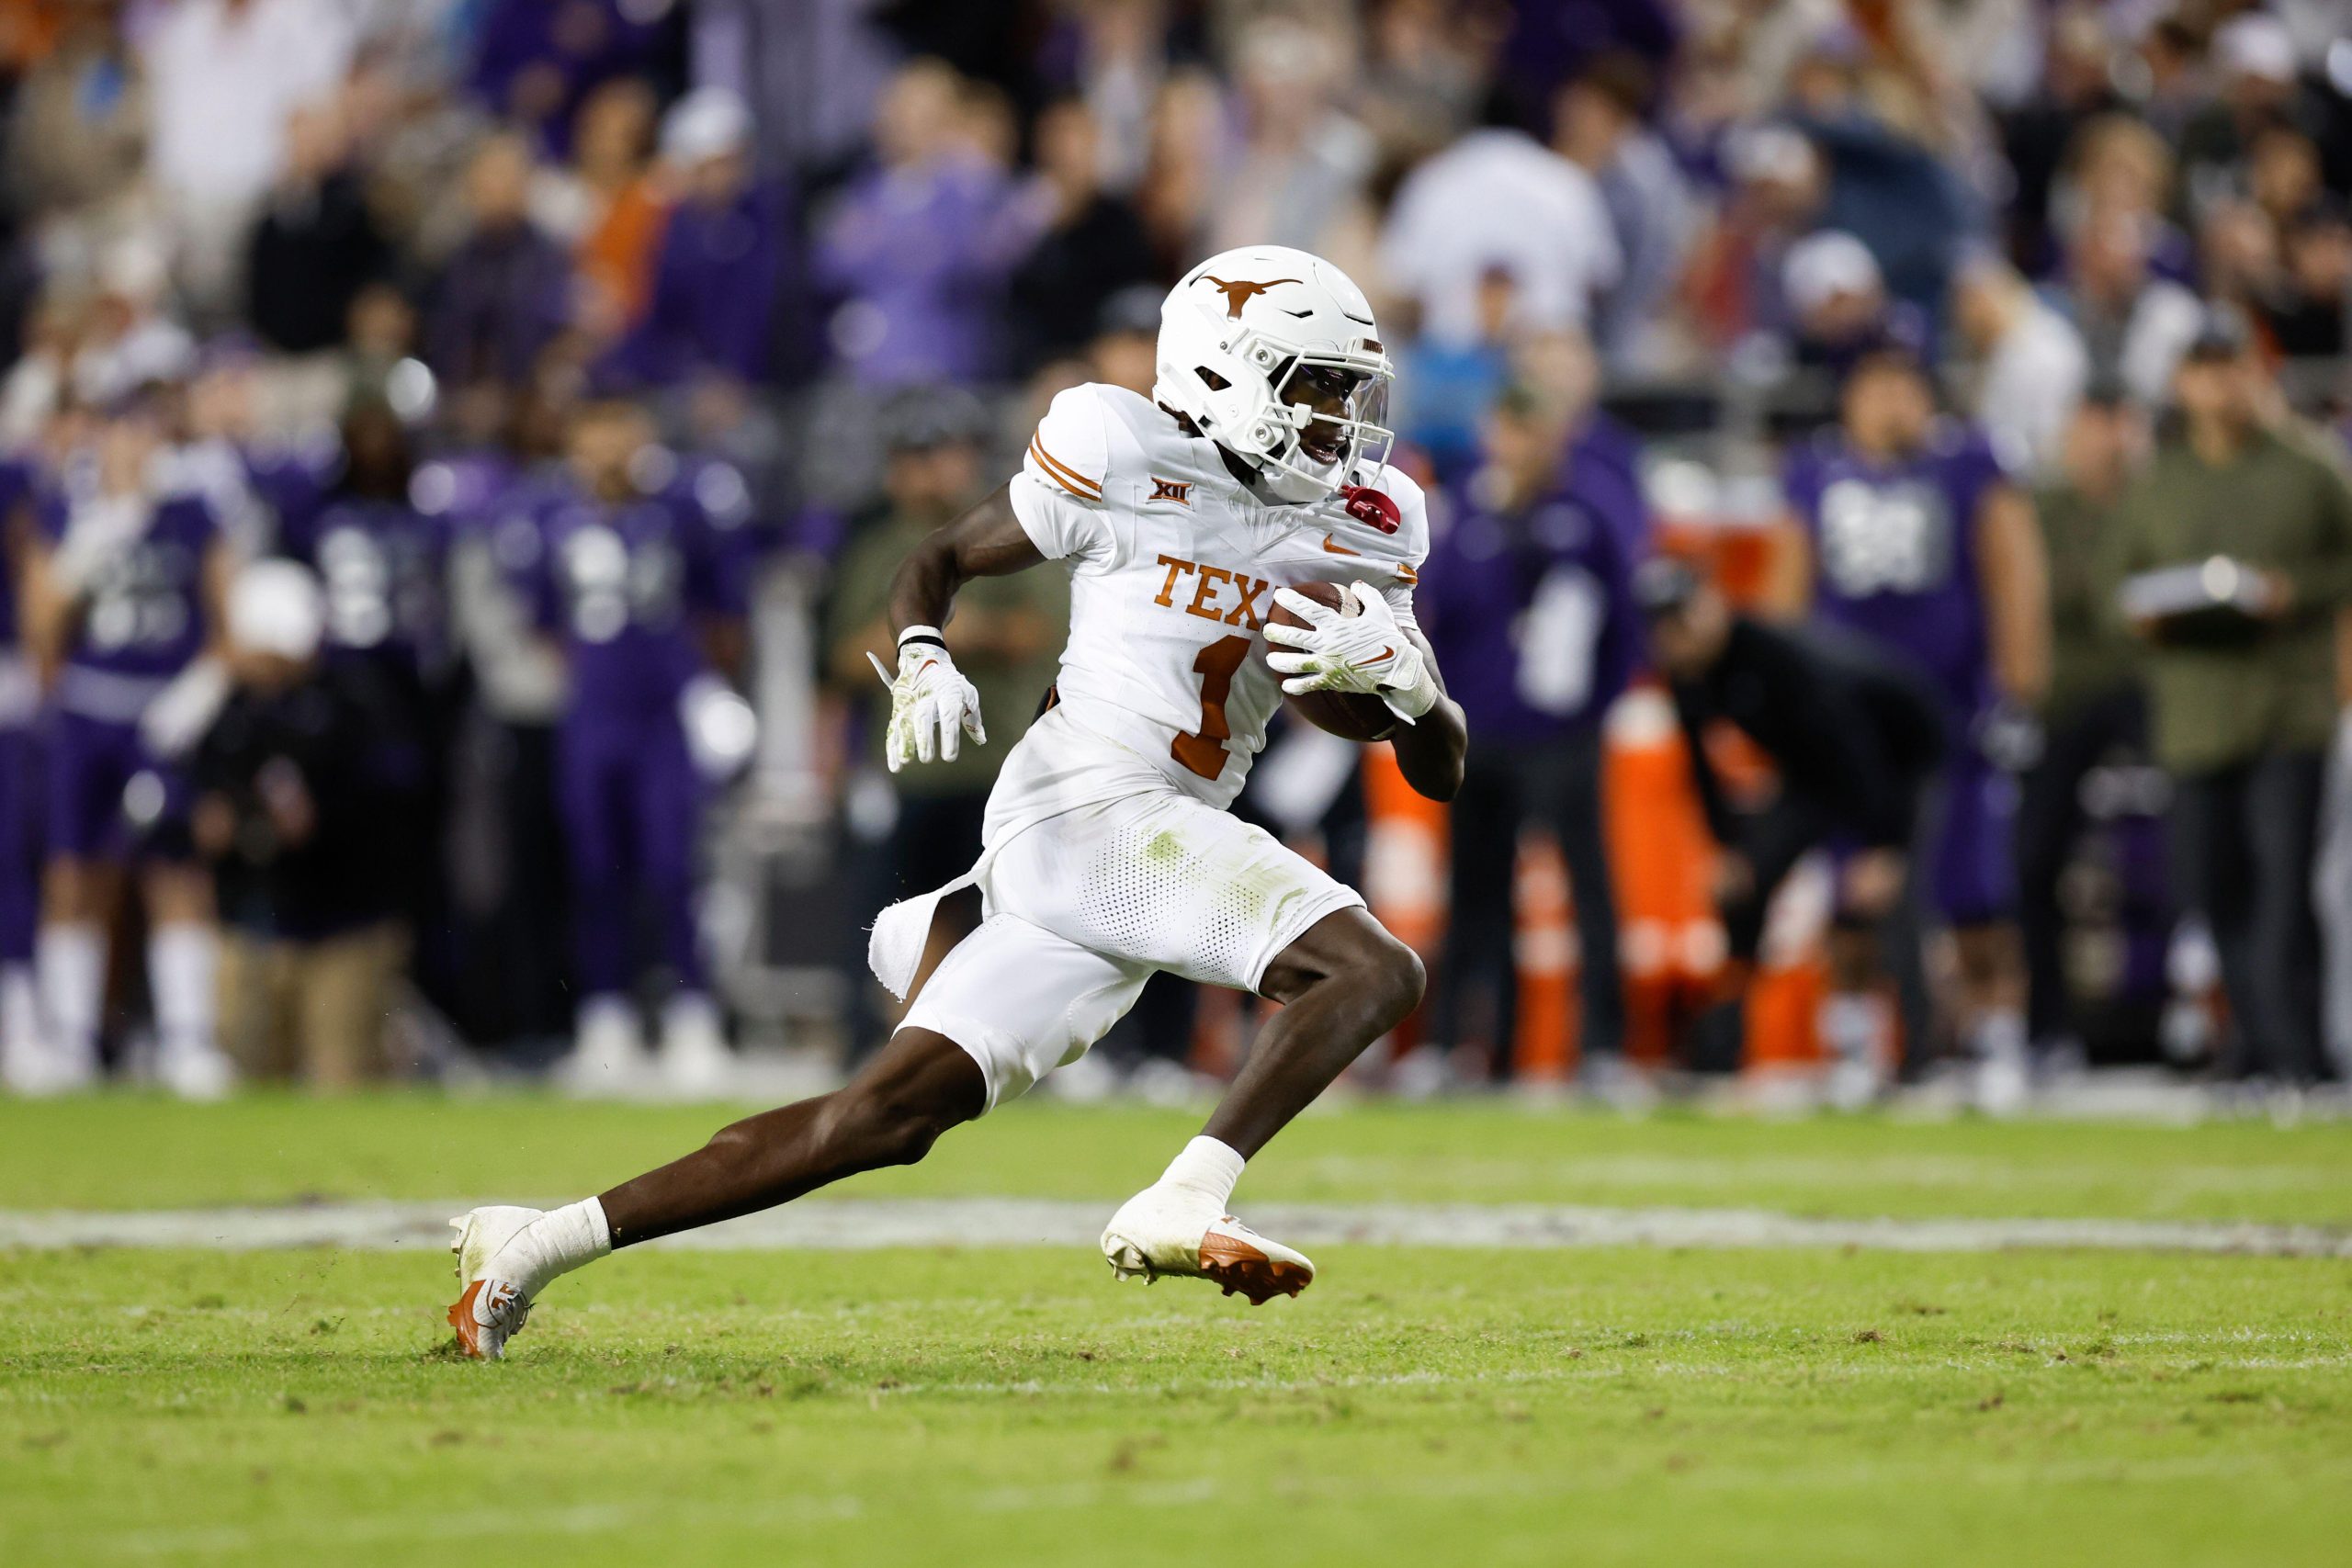
We hand out team grades for all five trades that went down in the first round of the 2024 NFL Draft.
Fri, 26 Apr 24 14:00:39 +0000
NFL teams will look to address their remaining roster needs with the top talents who remain on the board ahead of Day 2 of the 2024 NFL Draft.
Fri, 26 Apr 24 12:45:32 +0000
The five best remaining players at every position, including Iowa CB Cooper DeJean.
Fri, 26 Apr 24 06:35:57 +0000
Every NFL draft features several players who get taken much earlier than anticipated, and Round 1 of the 2024 NFL Draft was no different.
Fri, 26 Apr 24 05:48:41 +0000
The best available prospects are pulled from PFF’s final big board and will be updated throughout the 2024 NFL Draft.
Fri, 26 Apr 24 05:25:28 +0000
We dive into five steals from the first round of the 2024 NFL Draft.
Fri, 26 Apr 24 05:14:32 +0000
Max Chadwick provides Day 2 prospects with immediate starting potential in the 2024 NFL Draft.
Fri, 26 Apr 24 05:14:07 +0000
Nathan Jahnke reveals fantasy football winners and losers after Round 1 of the 2024 NFL Draft
Fri, 26 Apr 24 05:07:55 +0000
The first round of the 2024 NFL Draft is in the books, so now we’re here to take a swing at a Round 2 and Round 3 mock draft.
Fri, 26 Apr 24 04:56:36 +0000
Identifying Day 2 draft fits for all 32 teams in the 2024 NFL Draft.
Fri, 26 Apr 24 04:55:20 +0000
We provide one interesting stat for each first-round pick in the 2024 NFL Draft.
Fri, 26 Apr 24 04:20:03 +0000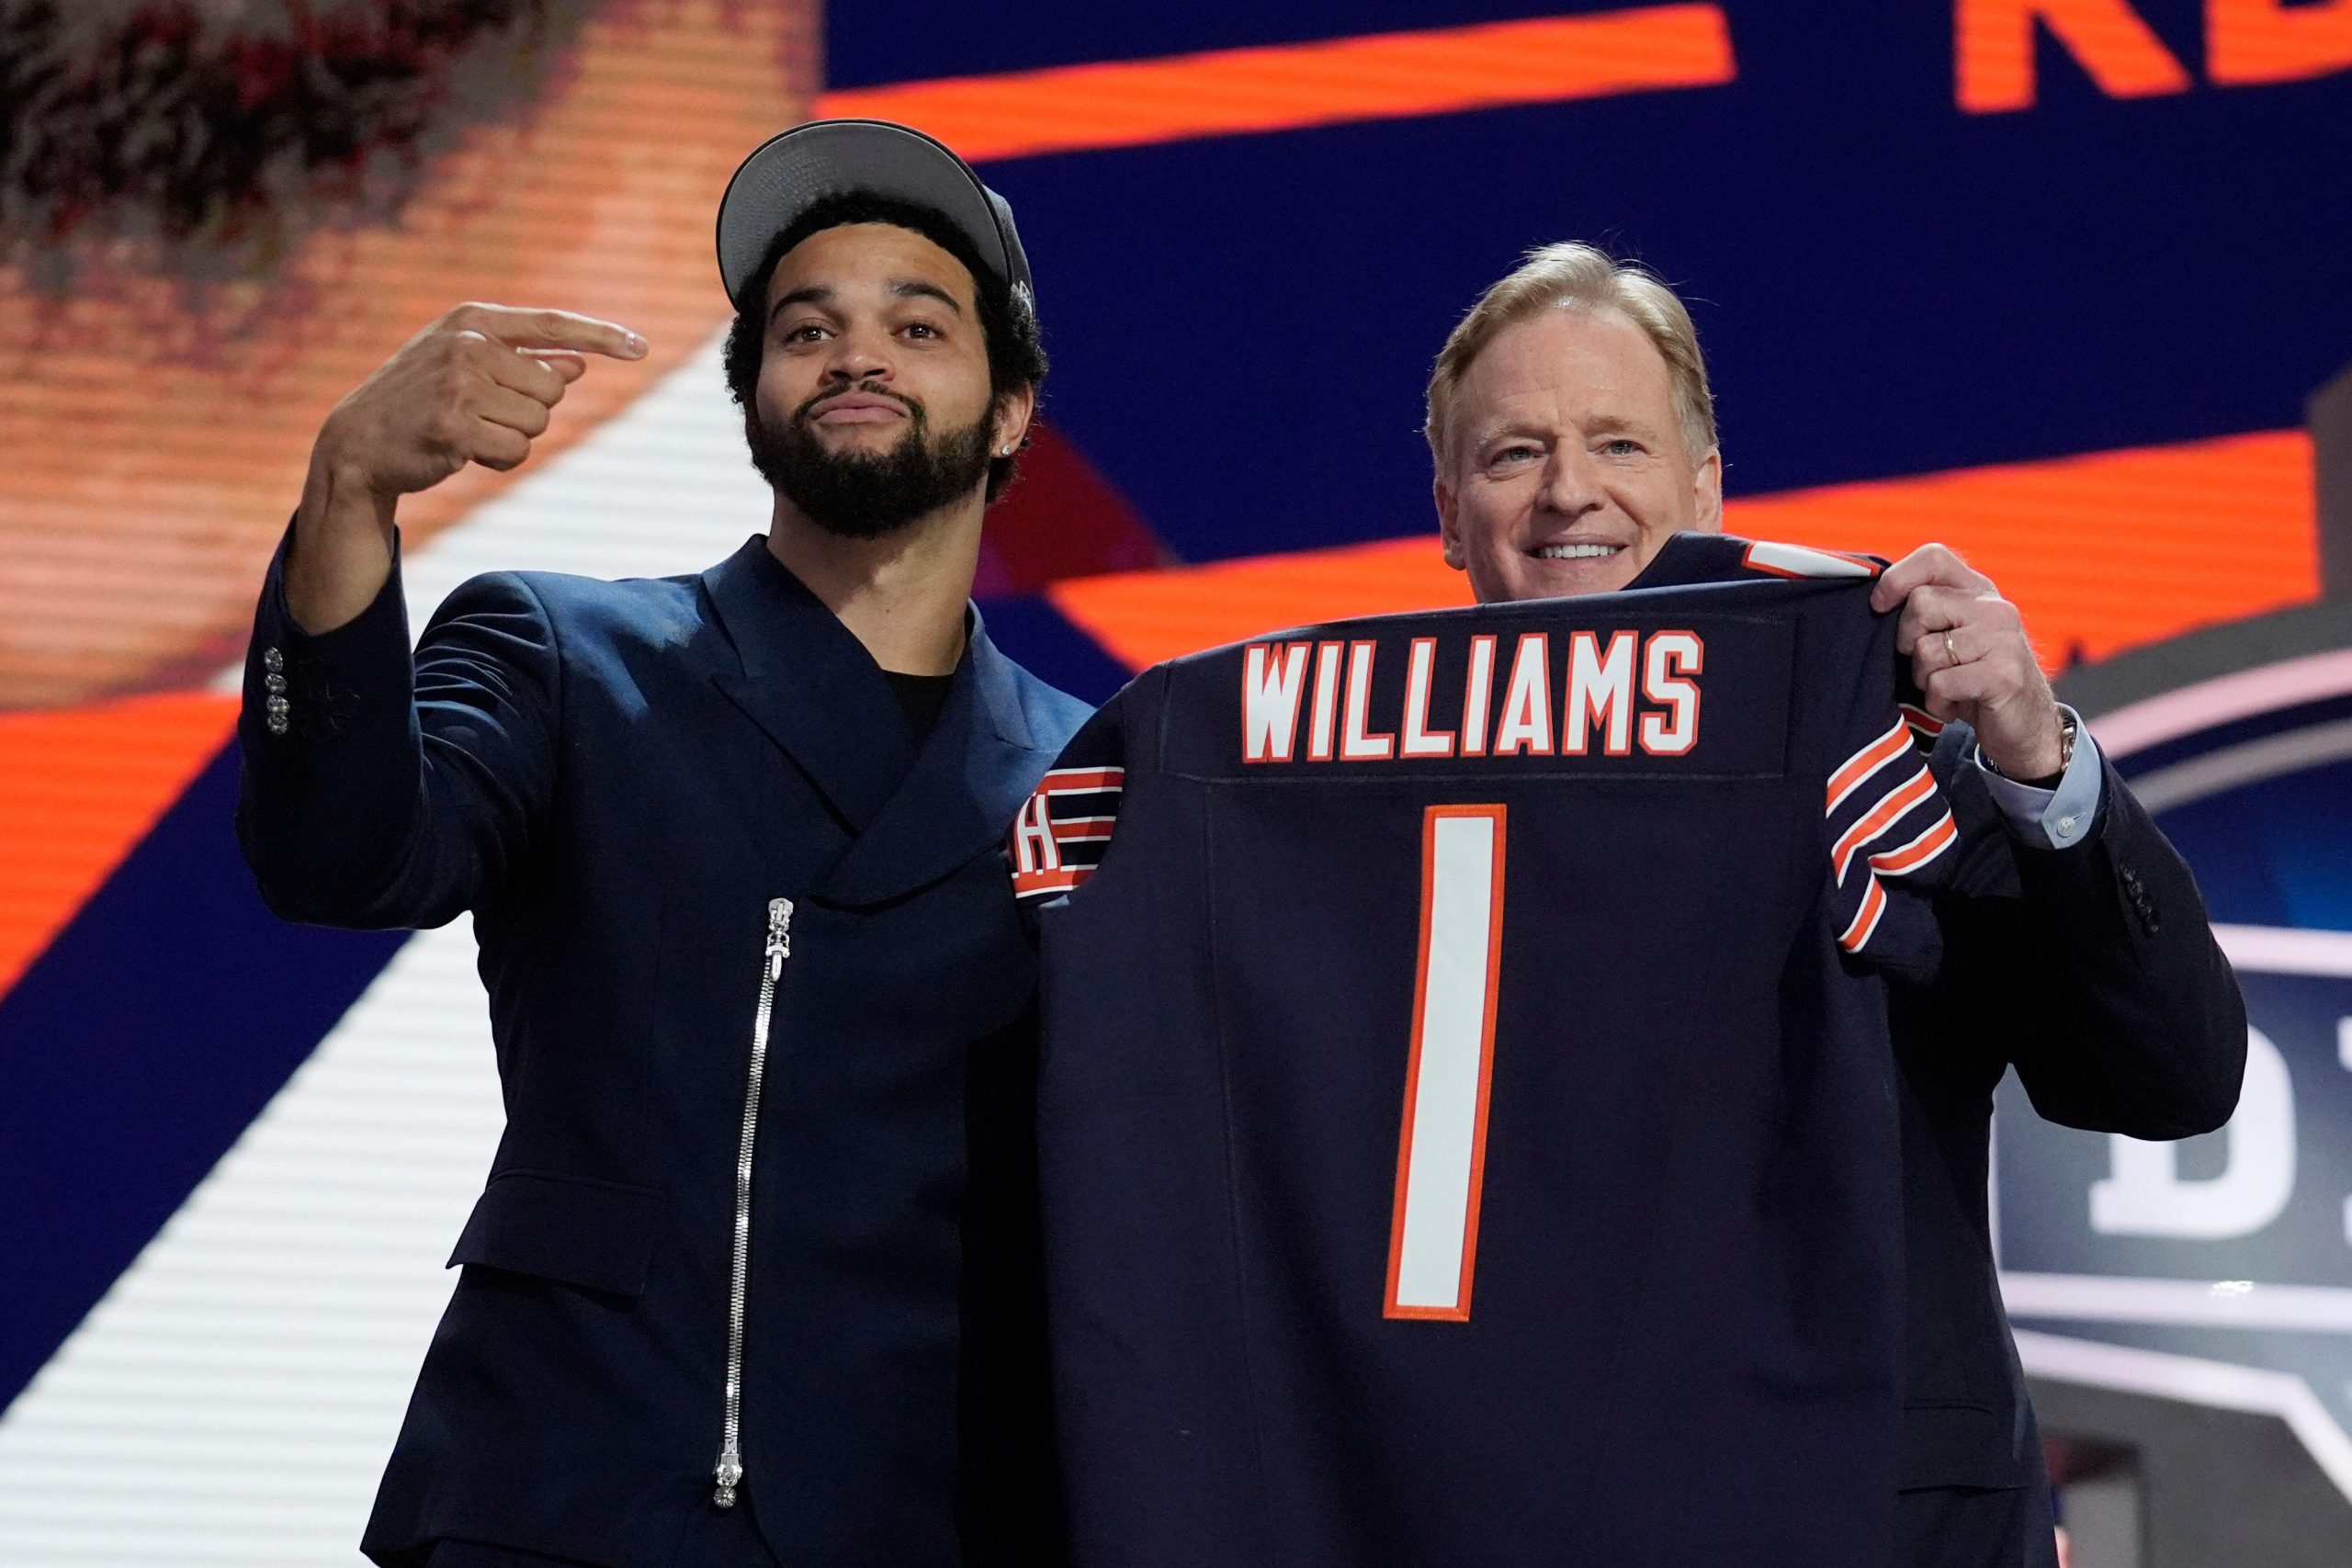
The Philadelphia Eagles' secondary and the Chicago Bears' passing attack are significantly improved after Day 1 of the 2024 NFL Draft.
Fri, 26 Apr 24 04:15:13 +0000
Over at PFF's live draft tracker, we analyzed every single pick in real time and gave a grade for each selection. Here is a quick recap of all those instant-reaction thoughts for all 32 first-round picks.
Fri, 26 Apr 24 04:00:04 +0000
Xavier Worthy has elite speed, as he showcased at this year’s combine when he ran a 4.21-second 40-yard dash. He’ll come in as a high-end, big-play weapon for Patrick Mahomes.
Fri, 26 Apr 24 03:52:14 +0000
New Jacksonville Jaguars wide receiver Brian Thomas Jr. joins the newly signed Gabe Davis and Christian Kirk in Jacksonville's wide receiver room and helps make up for the loss of Calvin Ridley,
Fri, 26 Apr 24 03:12:45 +0000
Despite some strong competition at the top of his position and an unideal offense to produce in, Bowers is talented enough to be considered as a top-12 option heading into this year due to the upside alone.
Fri, 26 Apr 24 02:05:45 +0000
Nathan Jahnke provides an immediate fantasy football reaction to the Chicago Bears selecting Rome Odunze.
Fri, 26 Apr 24 01:17:27 +0000
Jon Macri provides an immediate fantasy football reaction to the New York Giants taking Malik Nabers.
Fri, 26 Apr 24 01:08:04 +0000All Featured Tools
-
Our exclusive database, featuring the most in-depth collection of NFL player performance data.
Available with
PFF All News & Analysis
The latest football news, analysis, and rankings from PFF. Featuring data-driven rankings and stats for NFL, fantasy football, and the NFL Draft.
