What’s Hot
-
NFL2024 NFL Draft recap and rookie spotlight for all 32 teams
-
FantasyFantasy Football Rankings 2024: PPR top 400
-
NFLMost underrated player on all 32 NFL teams: Paulson Adebo, Trey Smith and more
-
NFLStrongest, weakest position groups after free agency and the 2024 NFL Draft
-
FantasyFantasy Football Rankings 2024: Superflex top 400
-
NFLOne major 2024 NFL Draft takeaway for all 32 NFL teams
-
NFLOne last offseason move for all 16 AFC teams
-
NFLOne last offseason move for all 16 NFC teams
-
FantasyFantasy Football: Sleepers to target late in 2024 dynasty rookie drafts
-
FantasyFantasy Football: 2024 dynasty rookie superflex mock draft
-
College & Draft2024 NFL Draft: Favorite picks for all 32 NFL teams
-
College & Draft2024 NFL Draft grades for all 32 teams
-
College & DraftWay-Too-Early 2025 NFL Mock Draft: James Pearce Jr. goes No. 1 to the Panthers
-
FantasyFantasy Football: Dynasty rankings after the 2024 NFL Draft
-
College & Draft2024 NFL Draft: Grades for all 32 first-round picks
-
College & Draft2024 NFL Draft Profiles: PFF's top 315 draft prospects
Mock Draft Simulator 2025
Be the GM for any team in the Draft.
In addition to picking draft prospects, you can also offer and make trades with the simulated teams.
2024 Offseason Overviews

Some NFL teams crushed free agency and the 2024 NFL Draft, while others floundered. Here's how we view each franchise's offseason.

PFF's full recap of the 2024 NFL Draft, with analysis on every selection the team made during the weekend and an in-depth look at every team's top pick.

Underrated players make up the core of many NFL teams' rosters, often providing valuable snaps at overlooked positions.

Nathan Jahnke reveals his fantasy football rankings for 2024 superflex leagues.

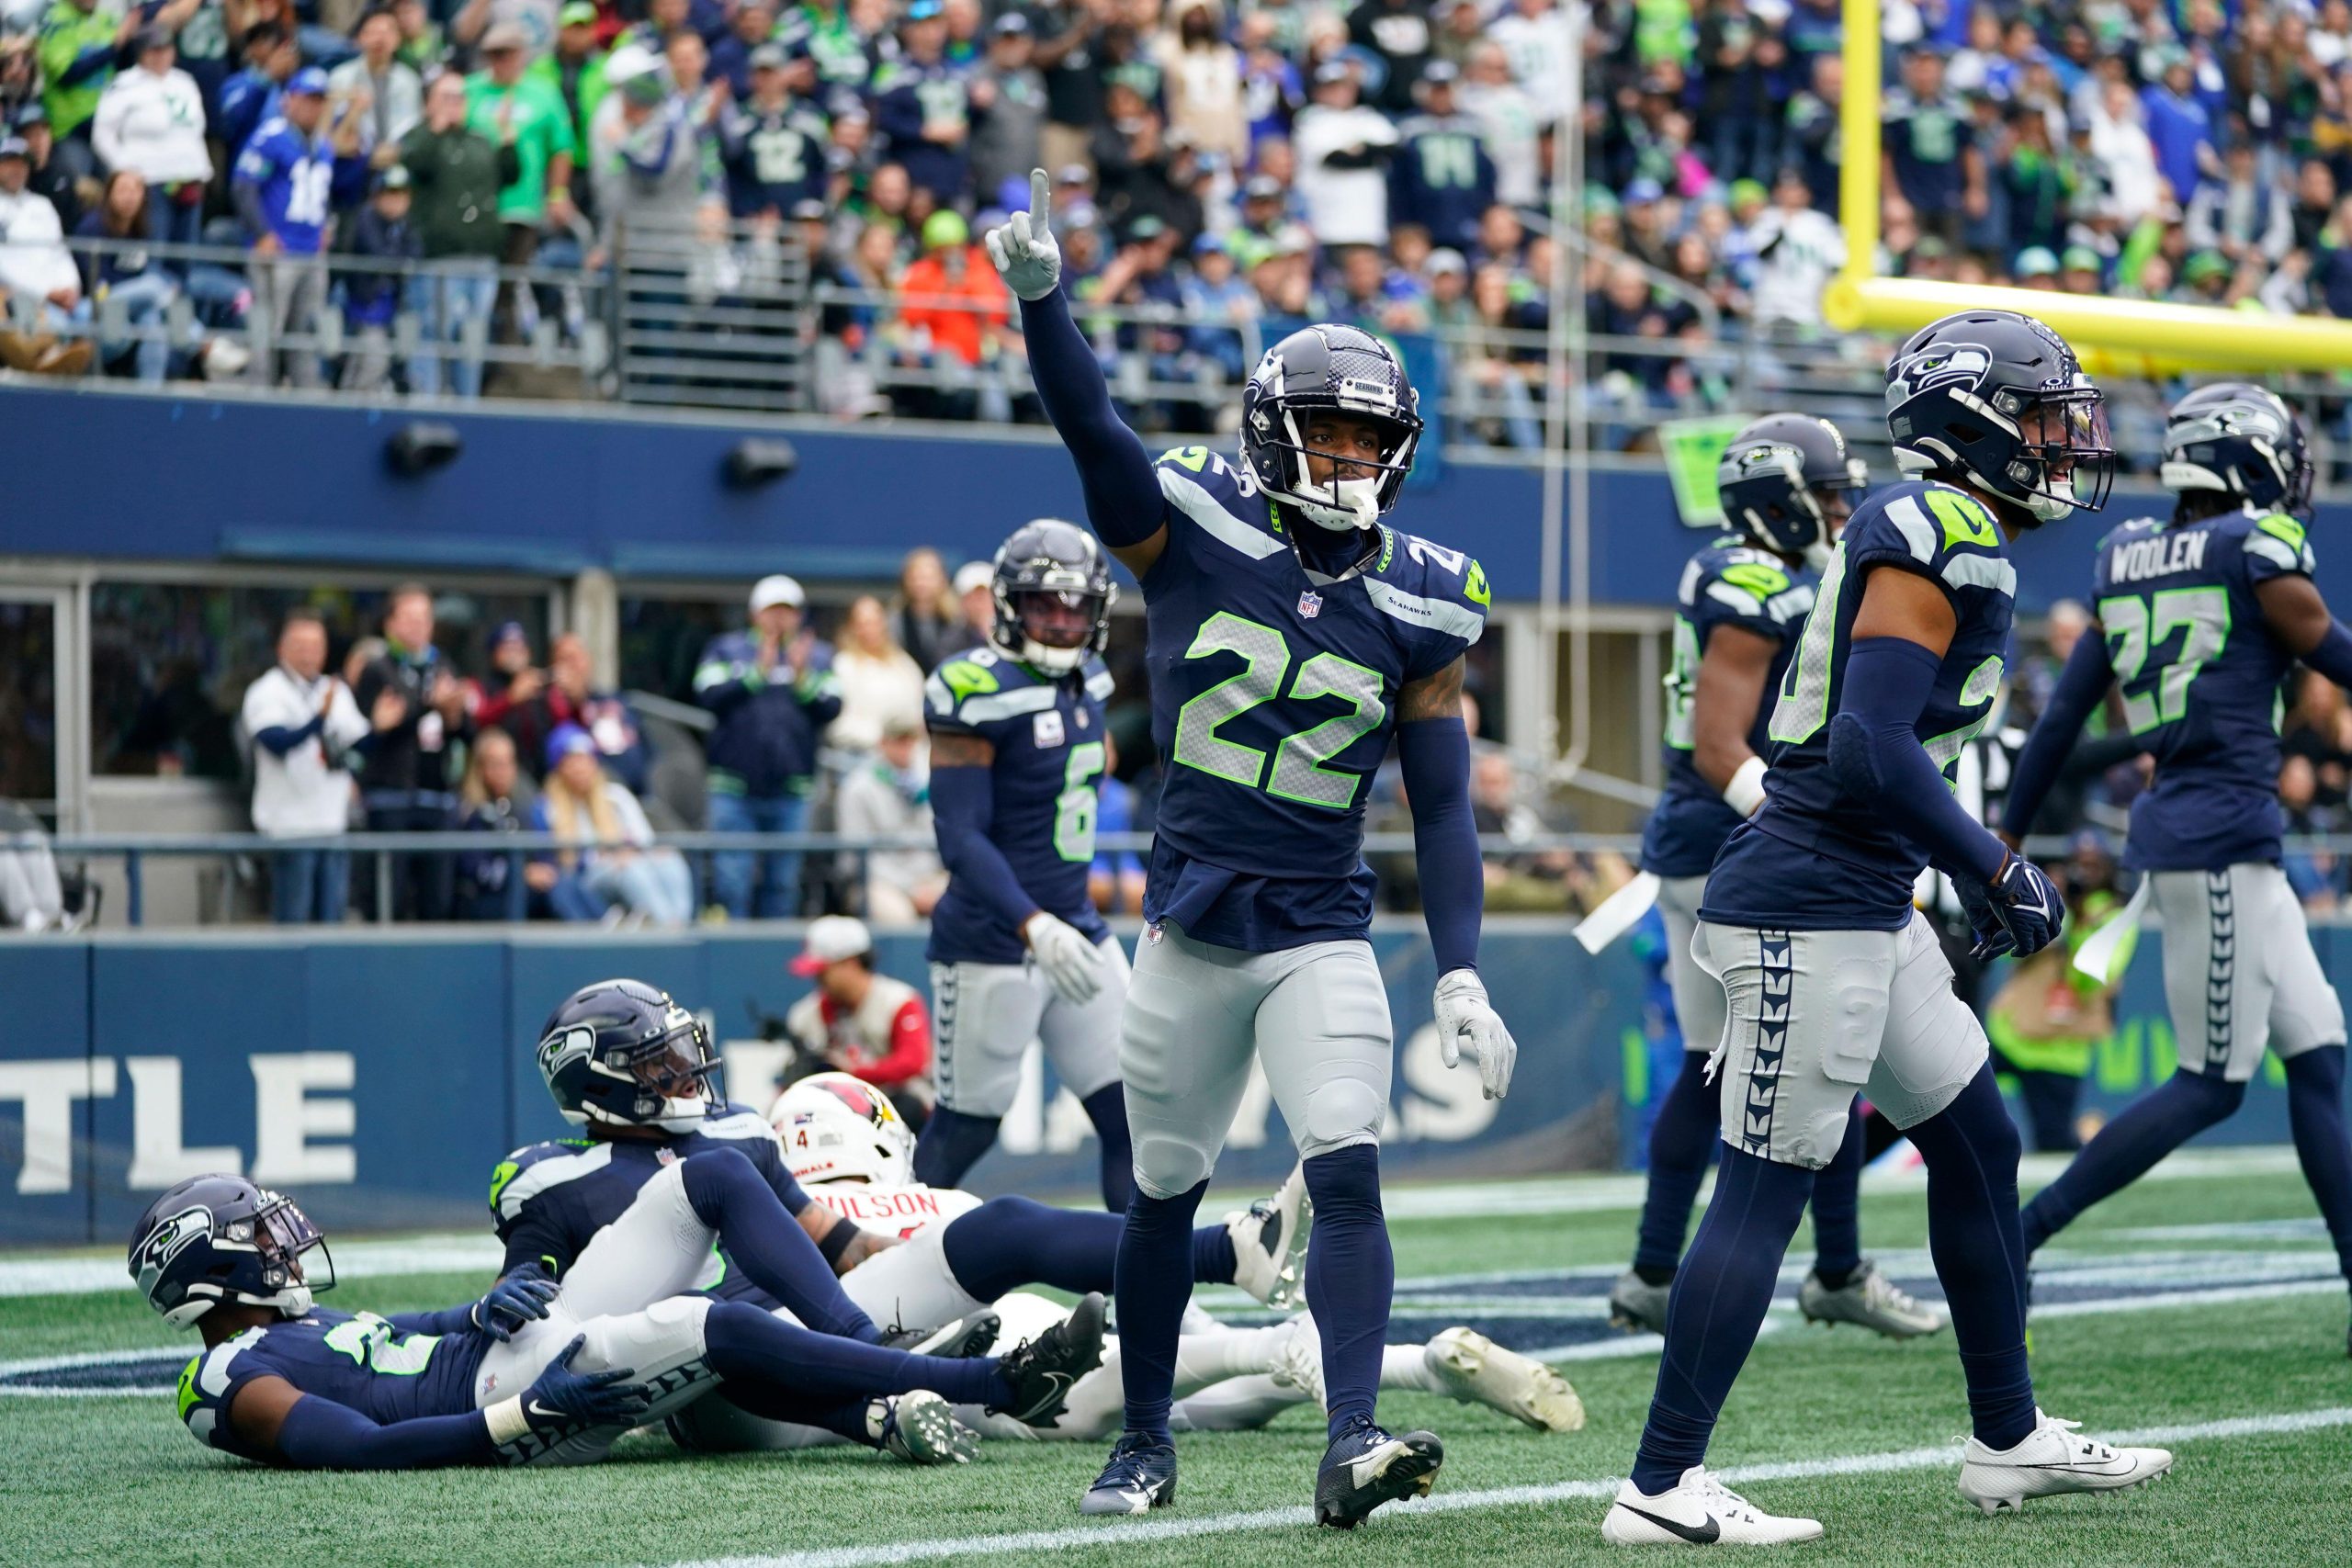
The Seattle Seahawks' Tre Brown takes the top spot among cornerbacks who saw at least 20 targets in press coverage last year,
Fri, 17 May 24 14:15:41 +0000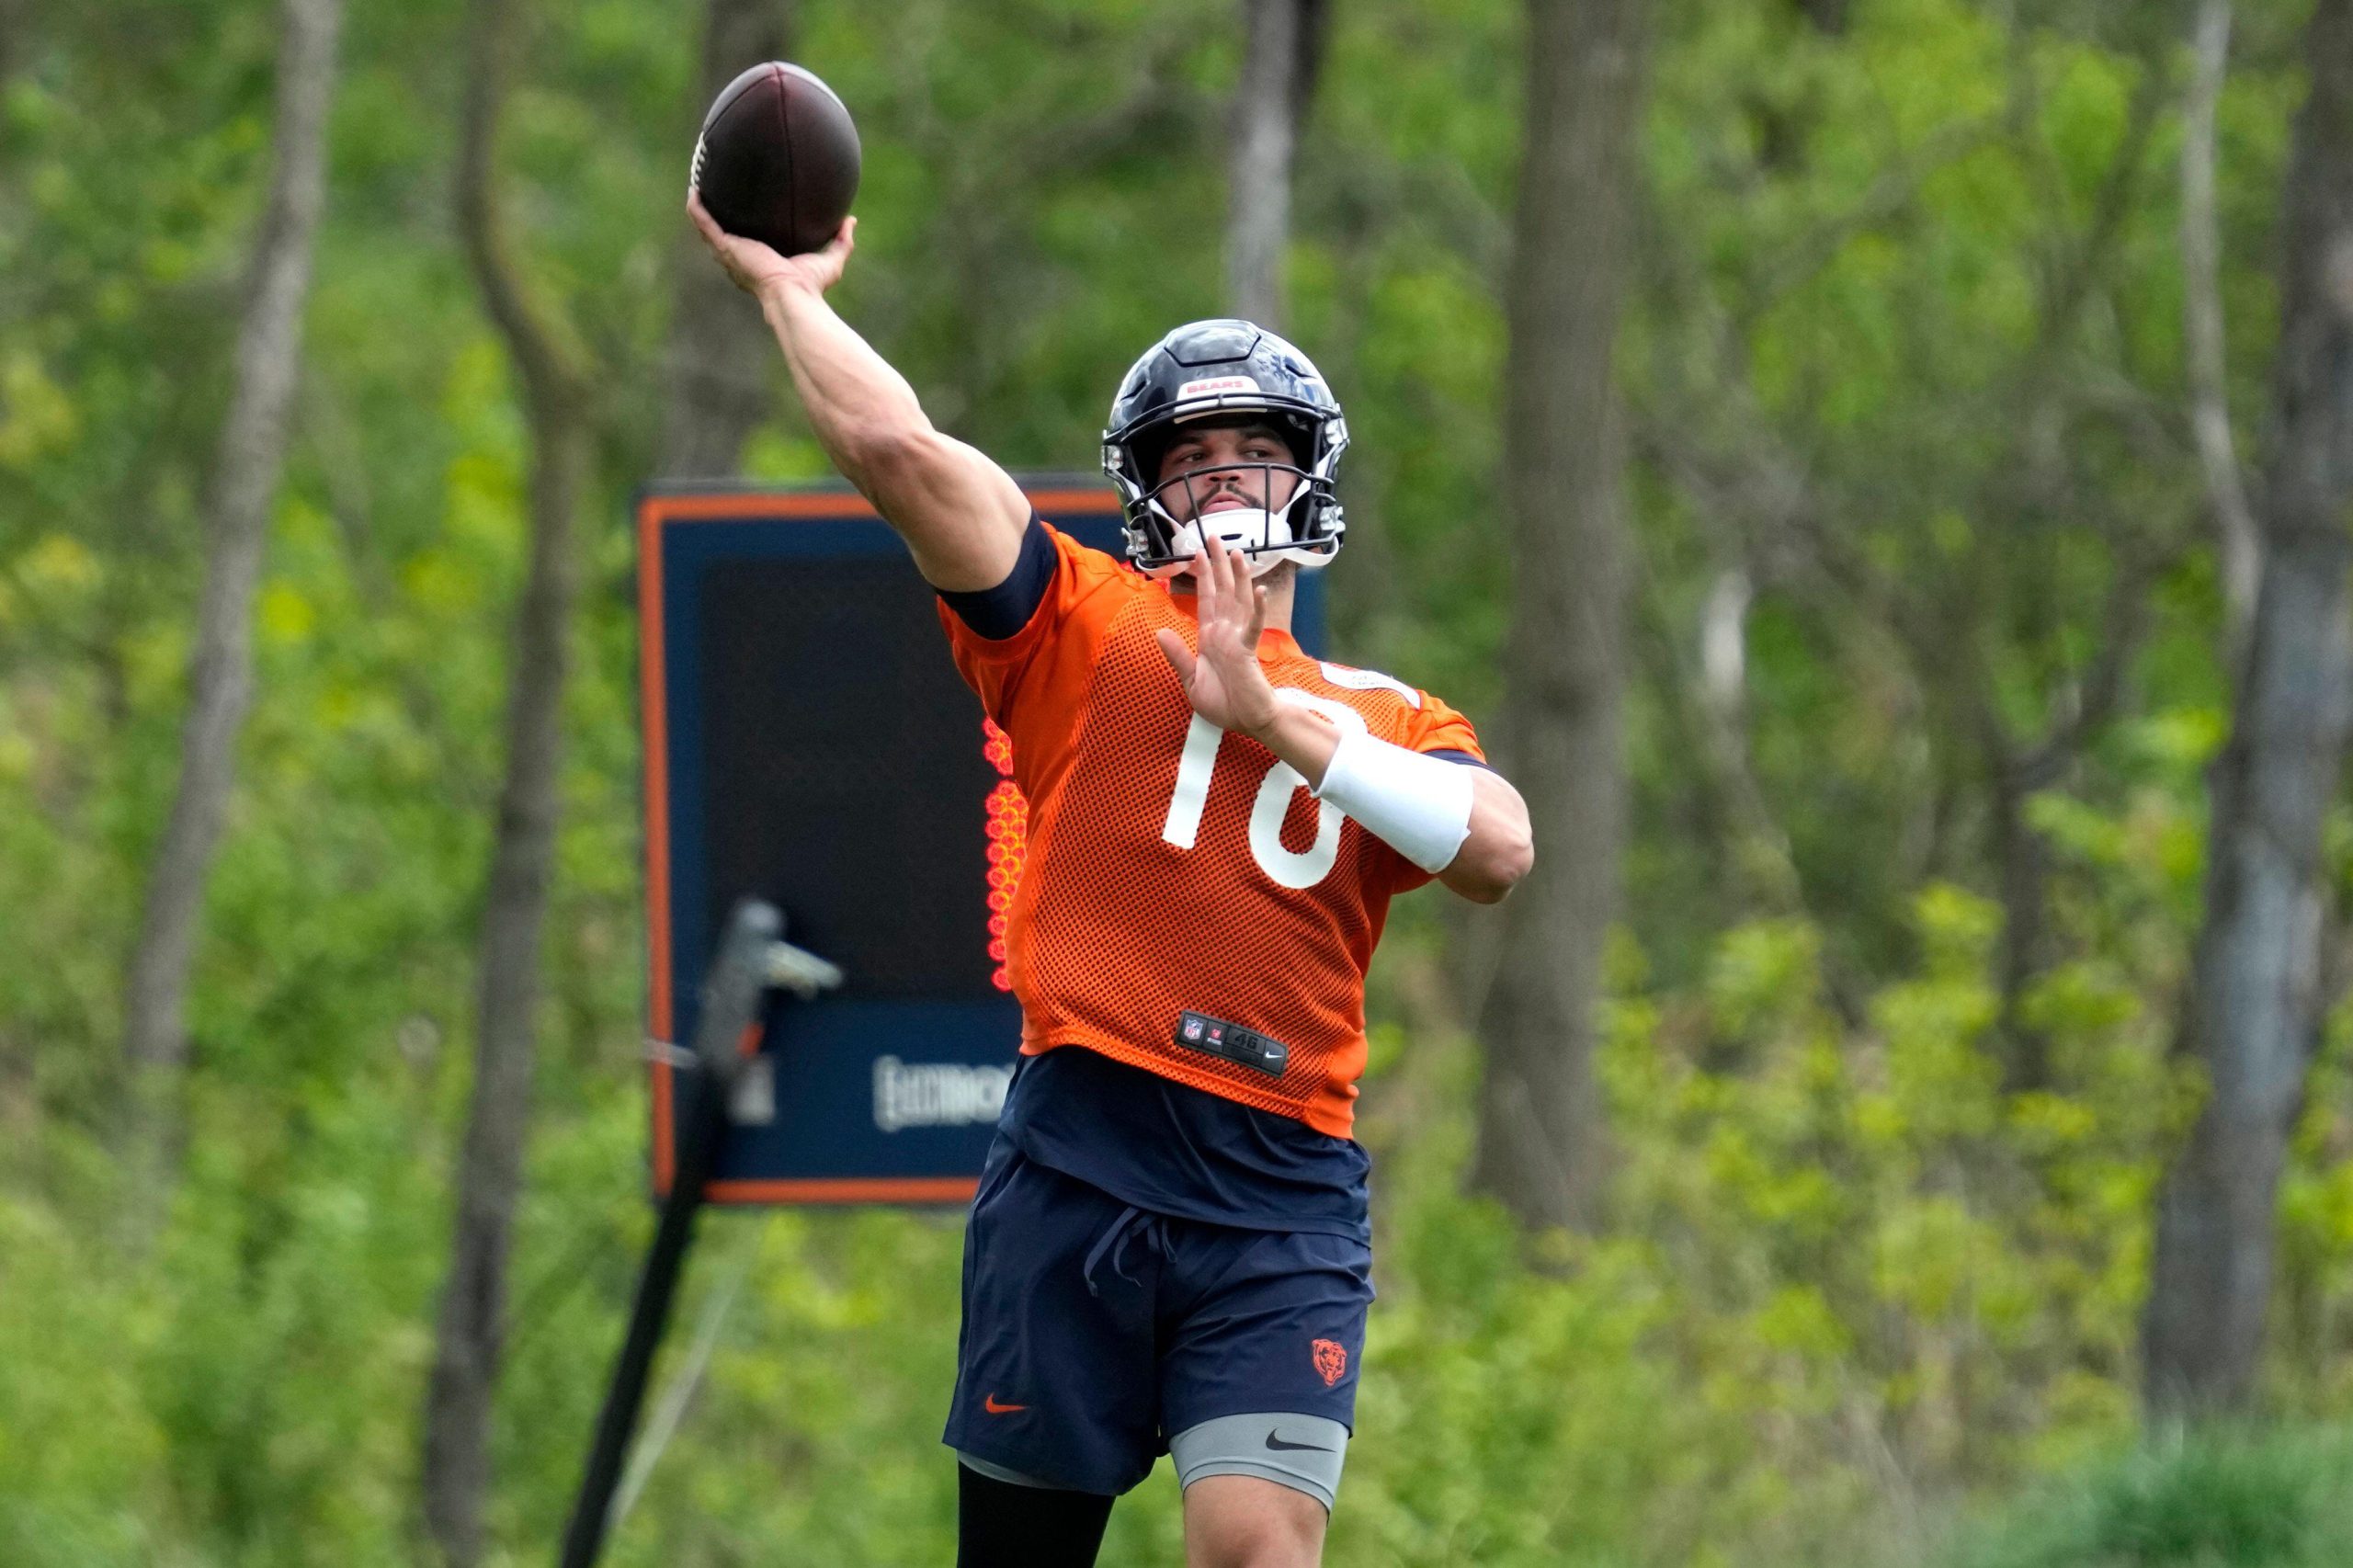
Caleb Williams, Jayden Daniels and Drake Maye, among other first-rounders, will be tested throughout the 2024 NFL season.
Fri, 17 May 24 13:00:10 +0000
We break down the best fantasy football value picks in Rounds 11-20 on Underdog Fantasy.
Fri, 17 May 24 11:15:50 +0000
Jon Macri reveals his IDP linebacker projections for fantasy football using defensive schemes from last season.
Fri, 17 May 24 09:15:12 +0000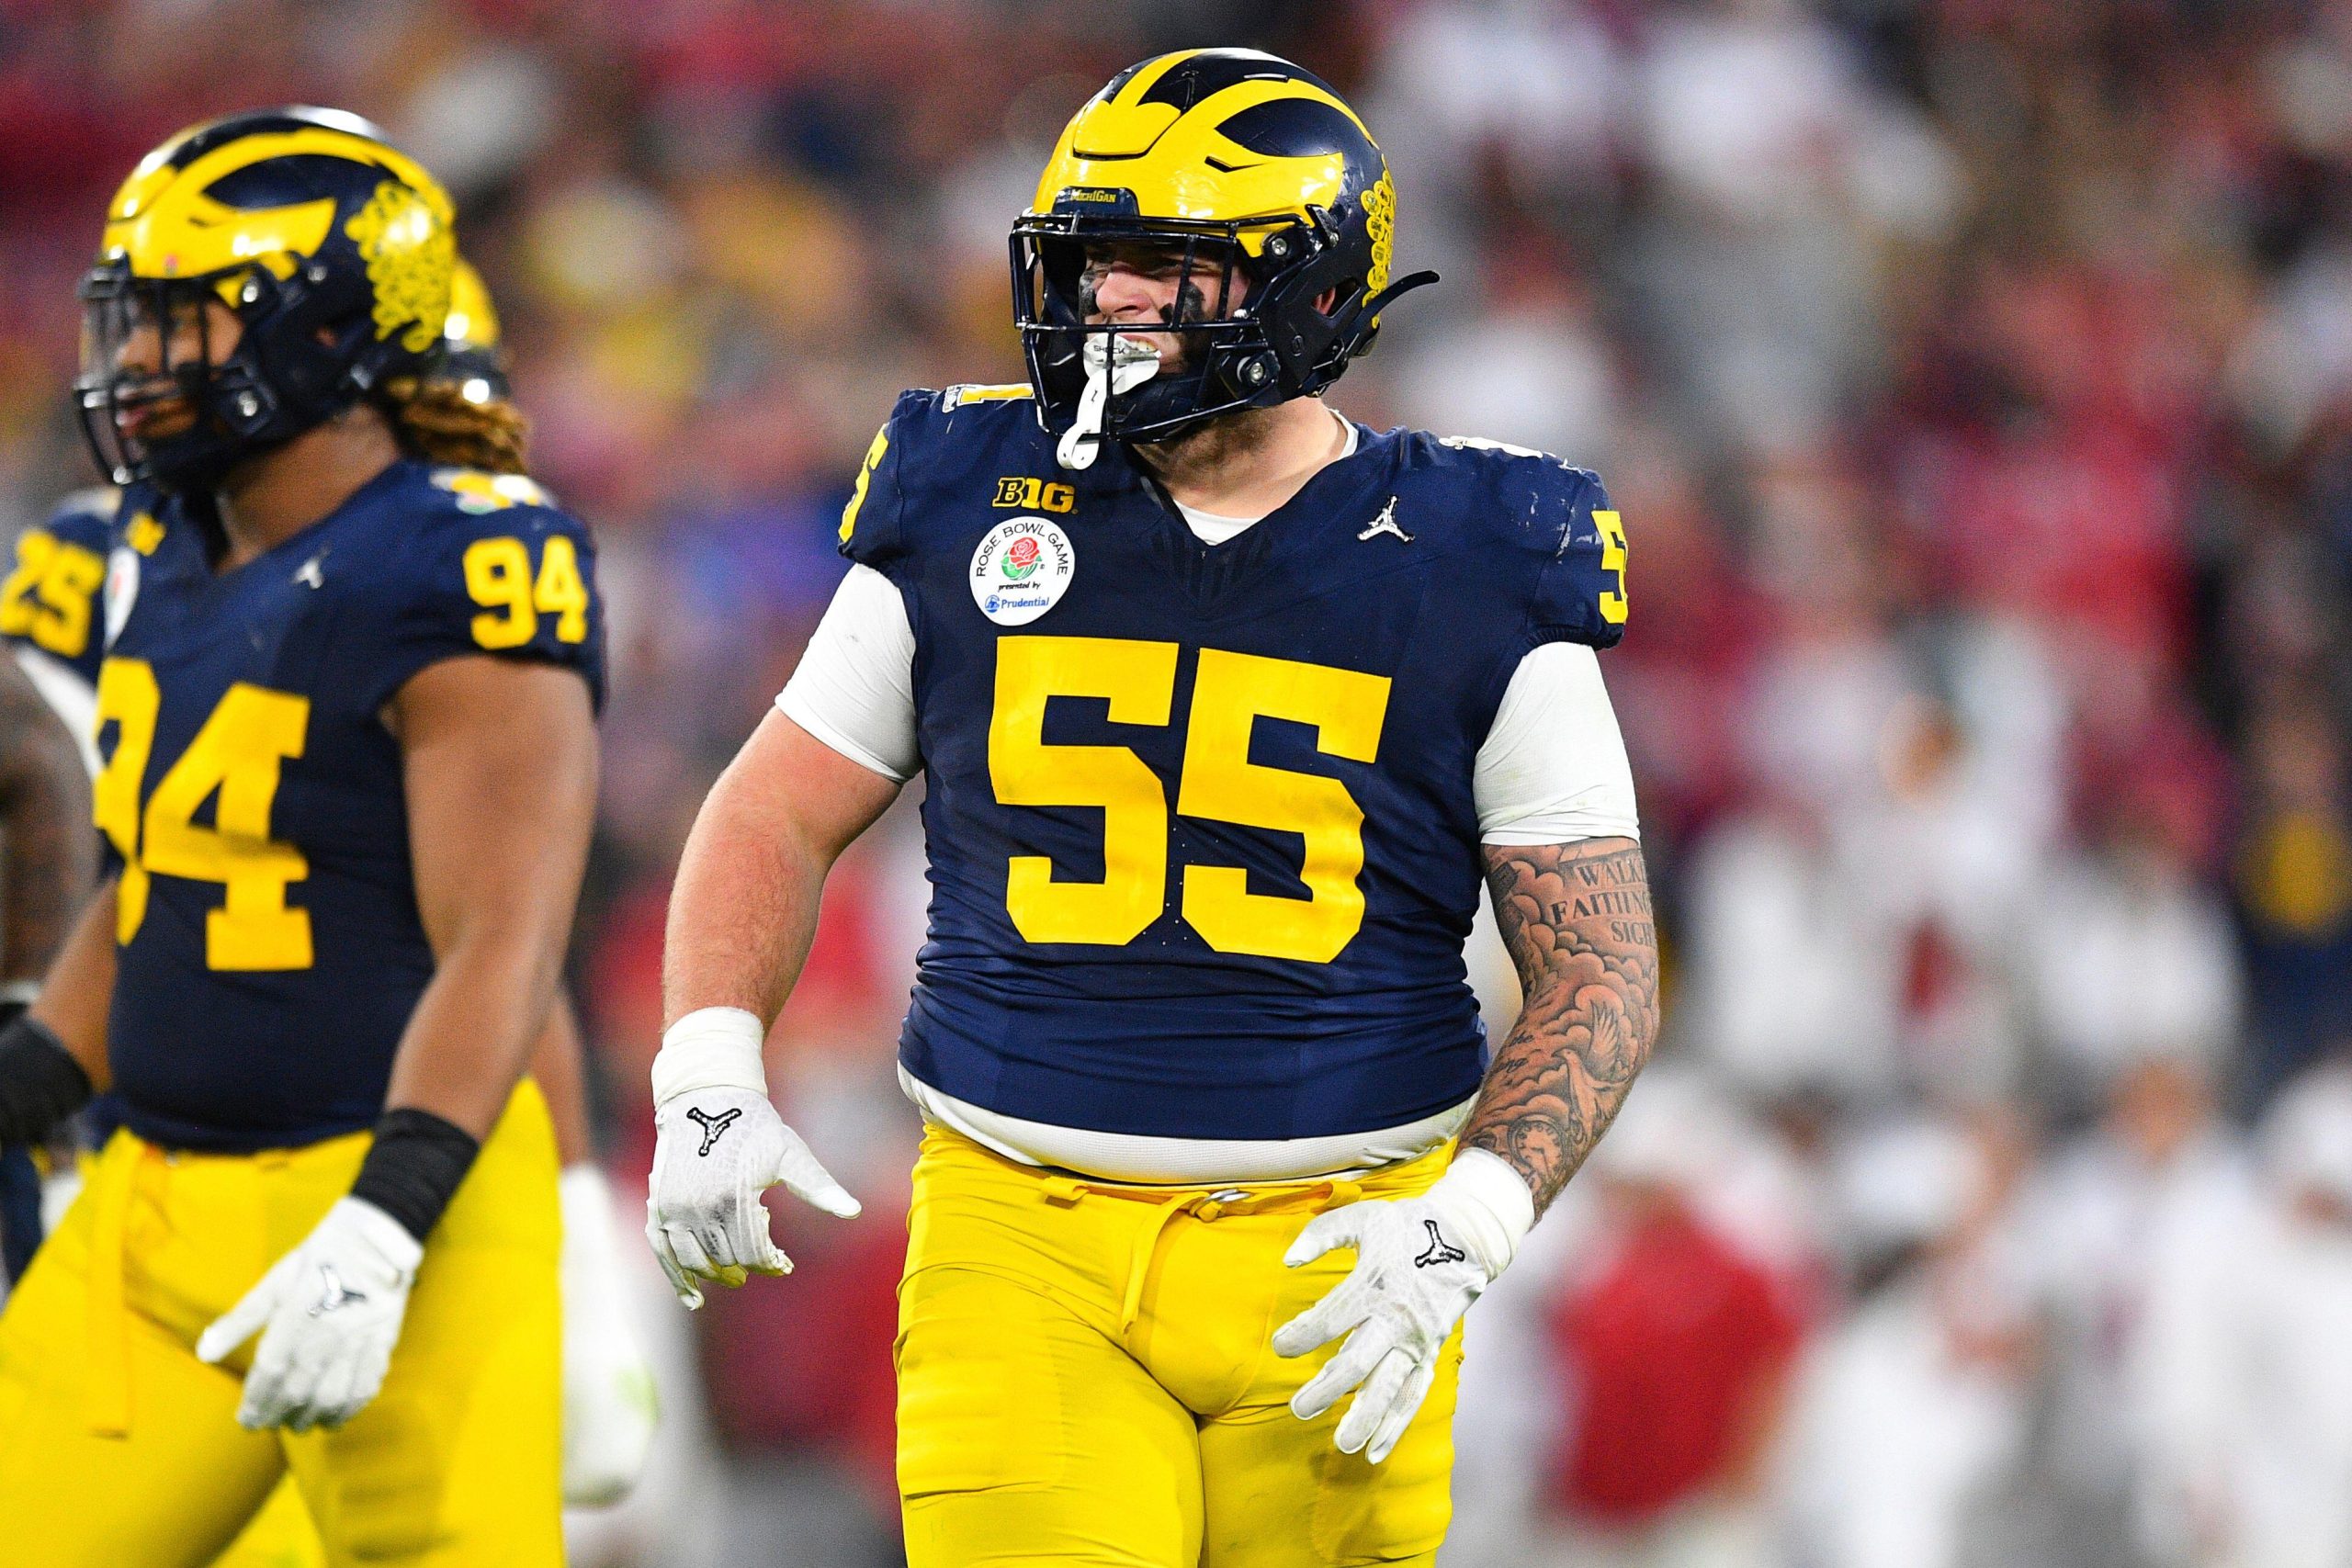
Max Chadwick breaks down 10 interior defensive linemen to know ahead of the 2025 NFL Draft.
Fri, 17 May 24 09:00:57 +0000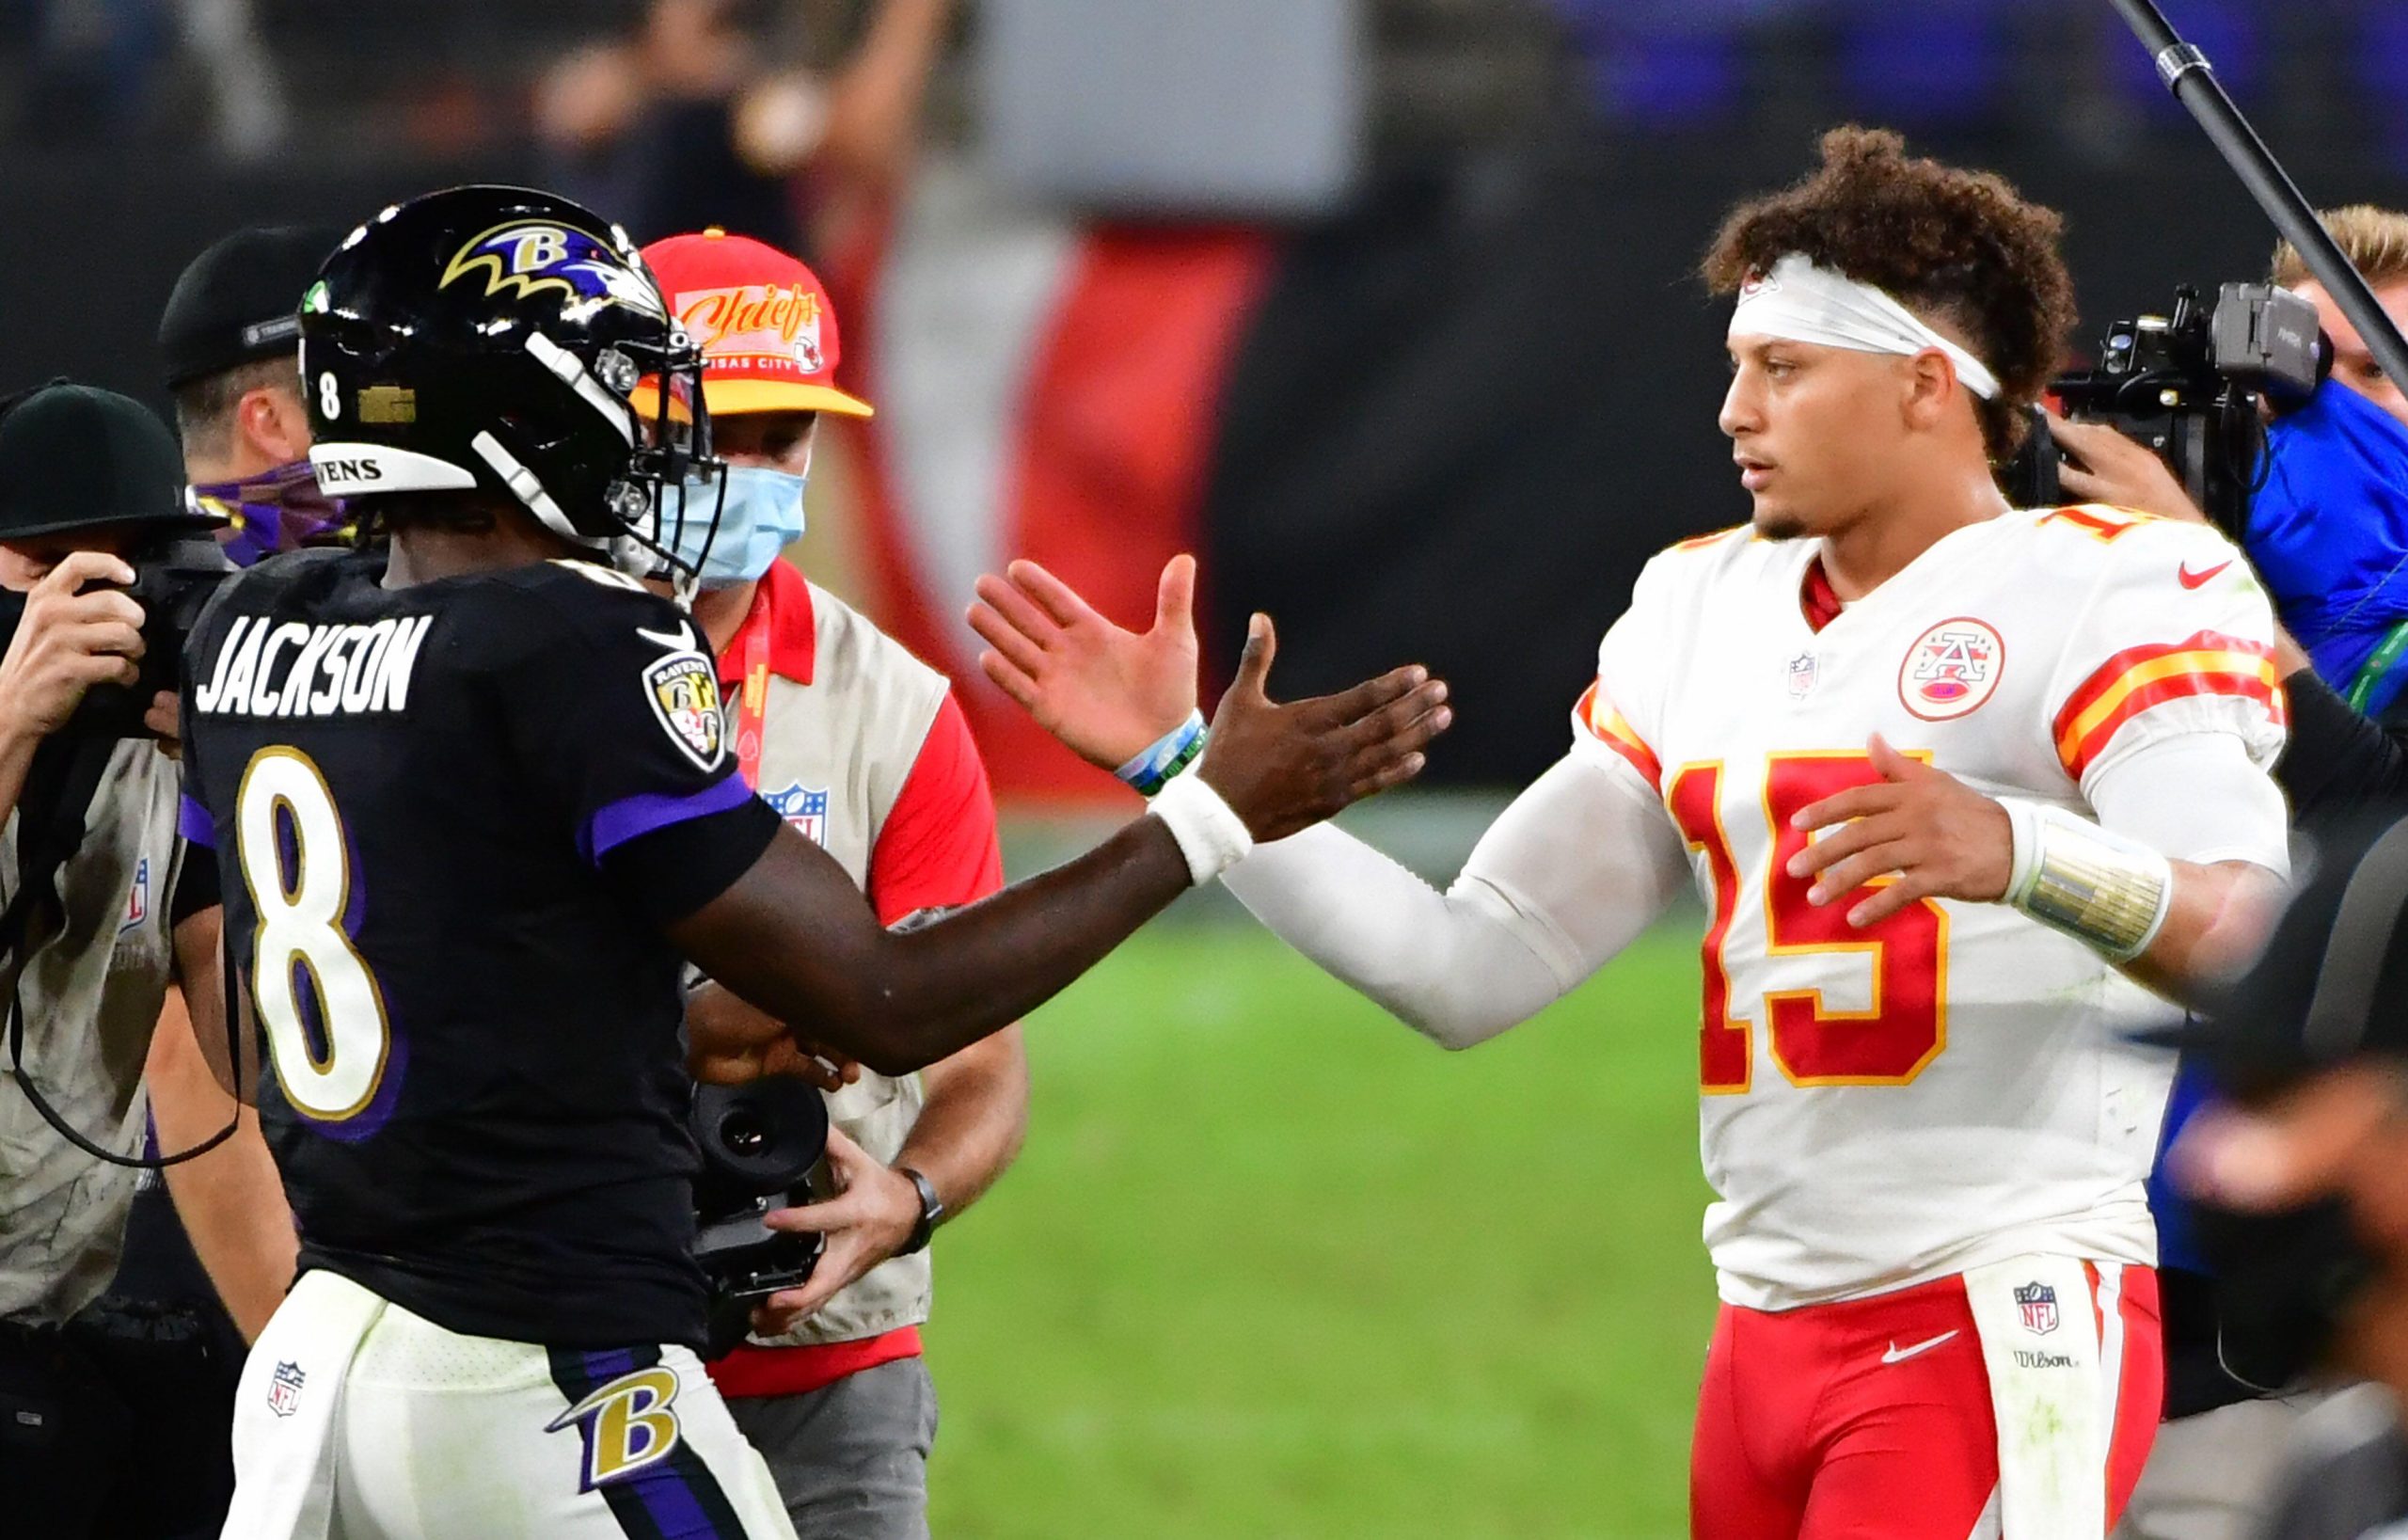
Bradley Lockers breaks down 10 games that could define the 2024 NFL season.
Thu, 16 May 24 15:23:42 +0000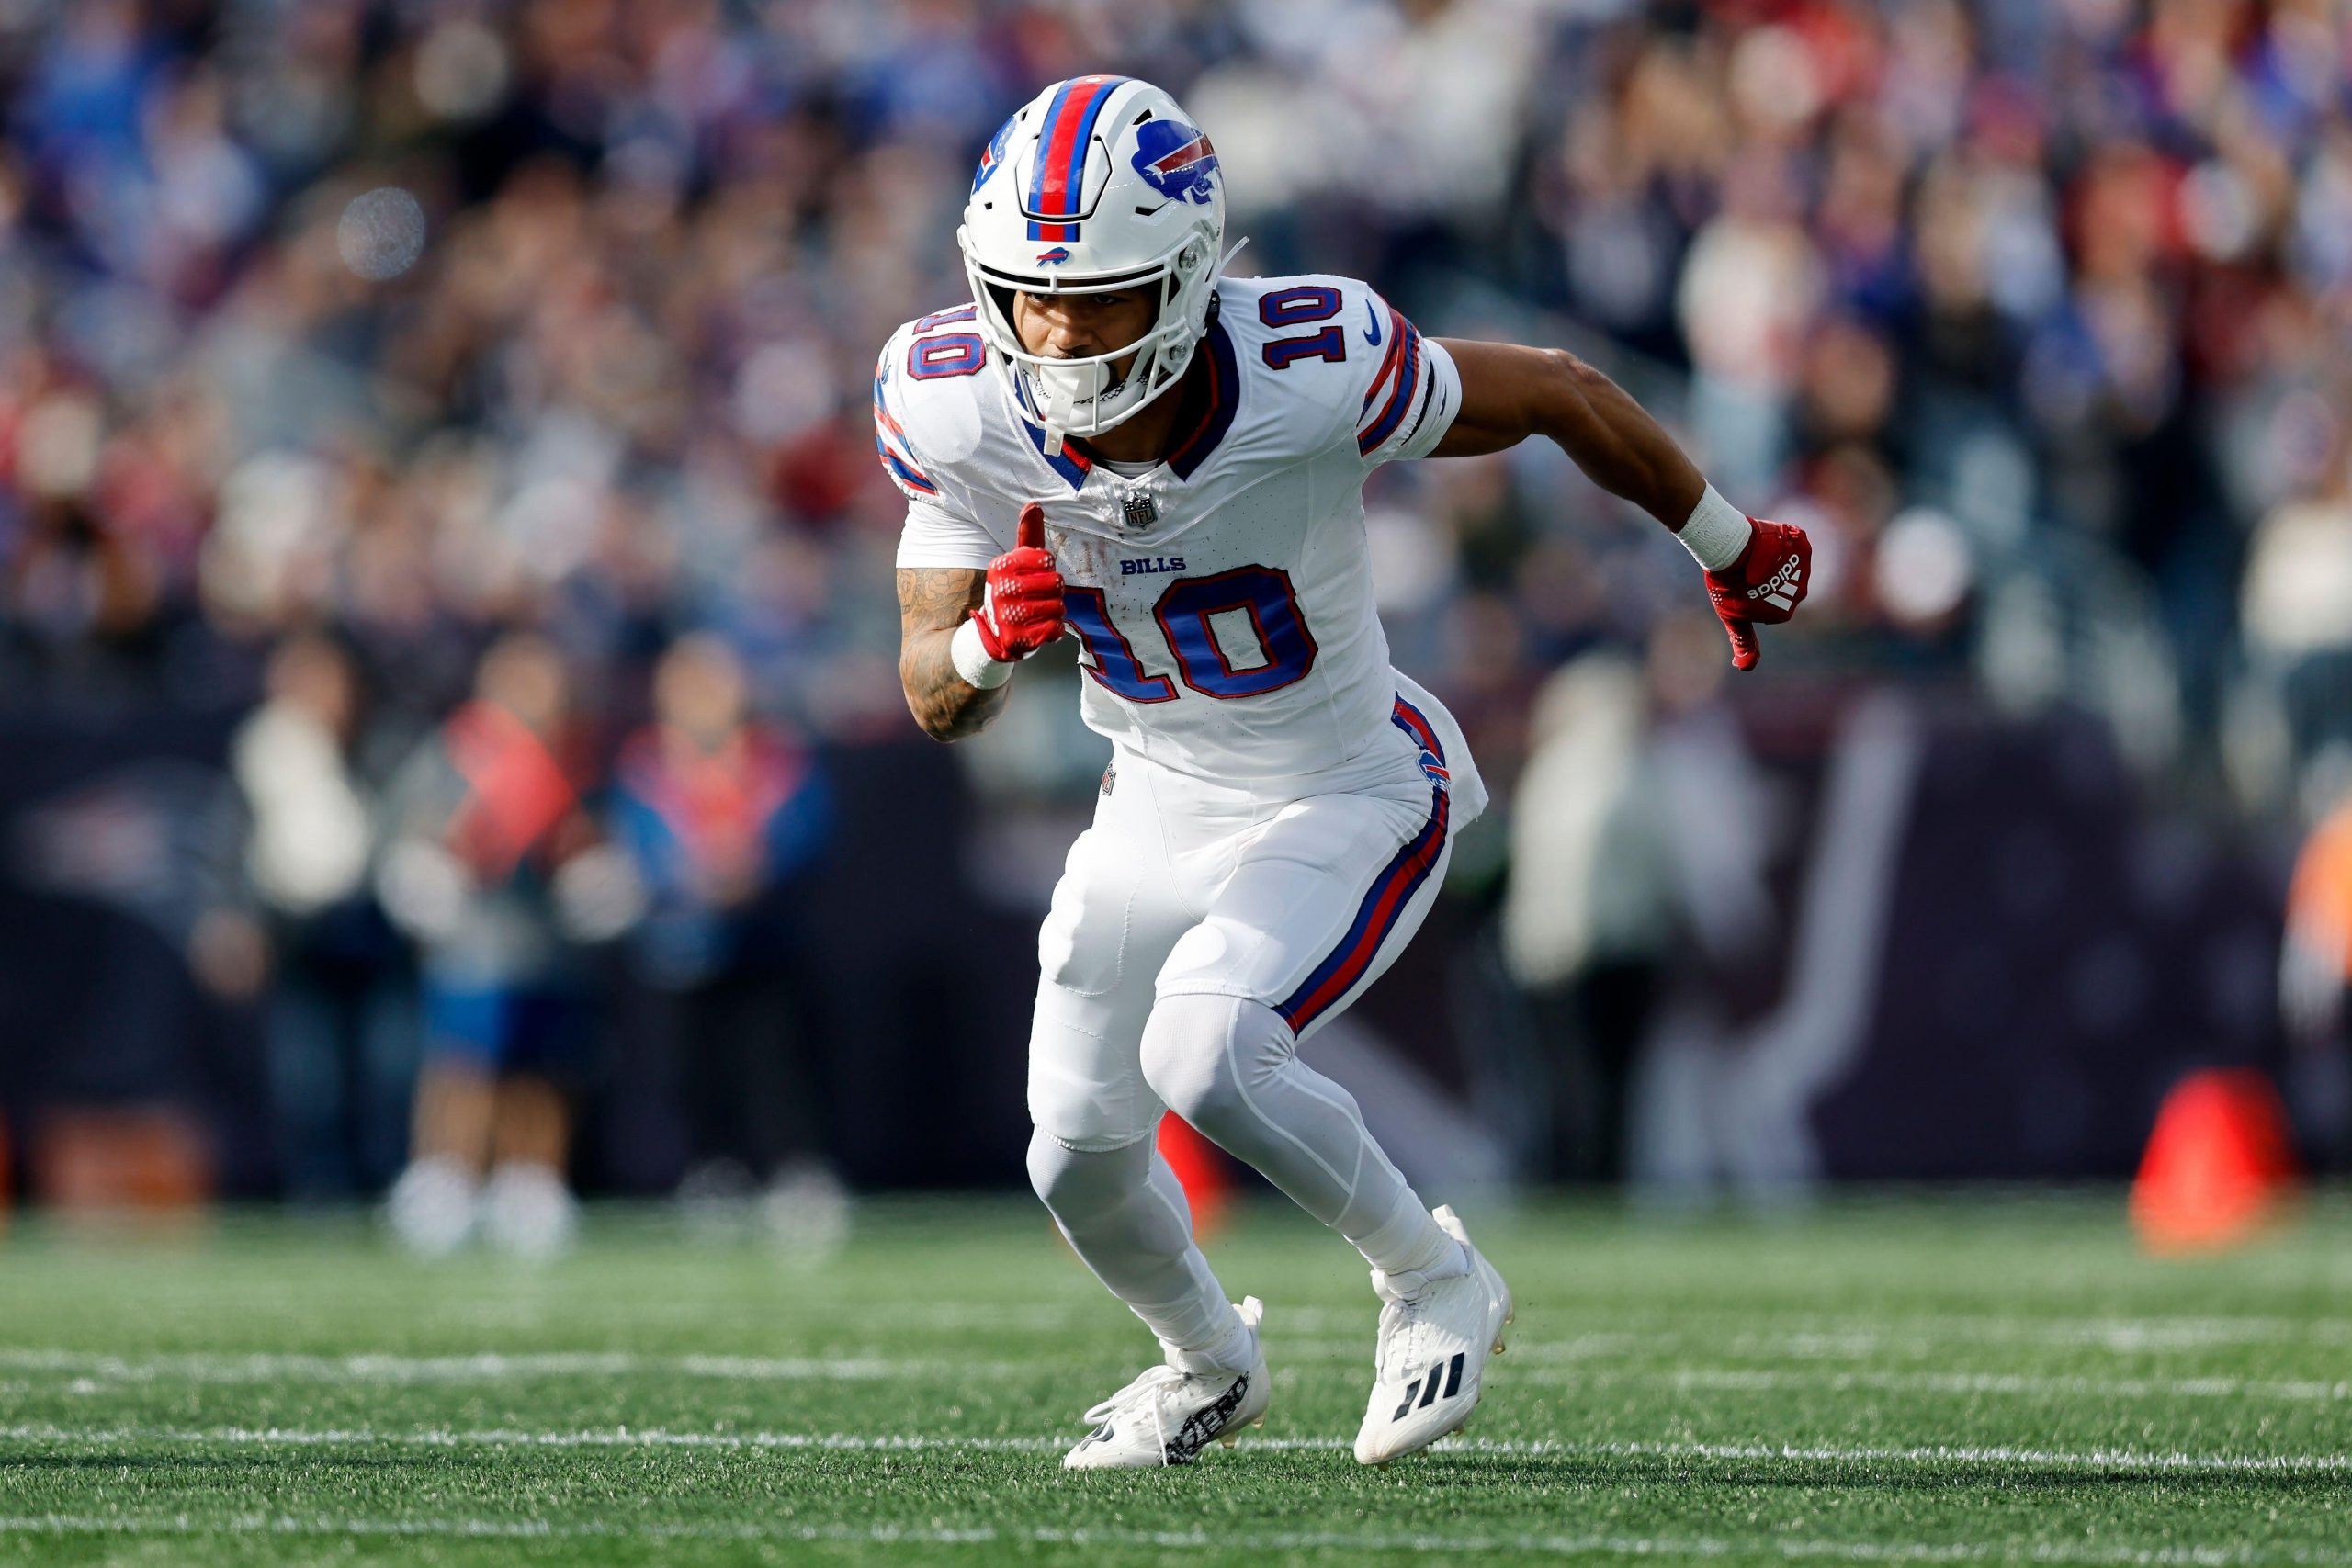
16 potential breakout candidates from the AFC, including Buffalo Bills WR Khalil Shakir and Steelers DI Keeanu Benton.
Thu, 16 May 24 14:07:17 +0000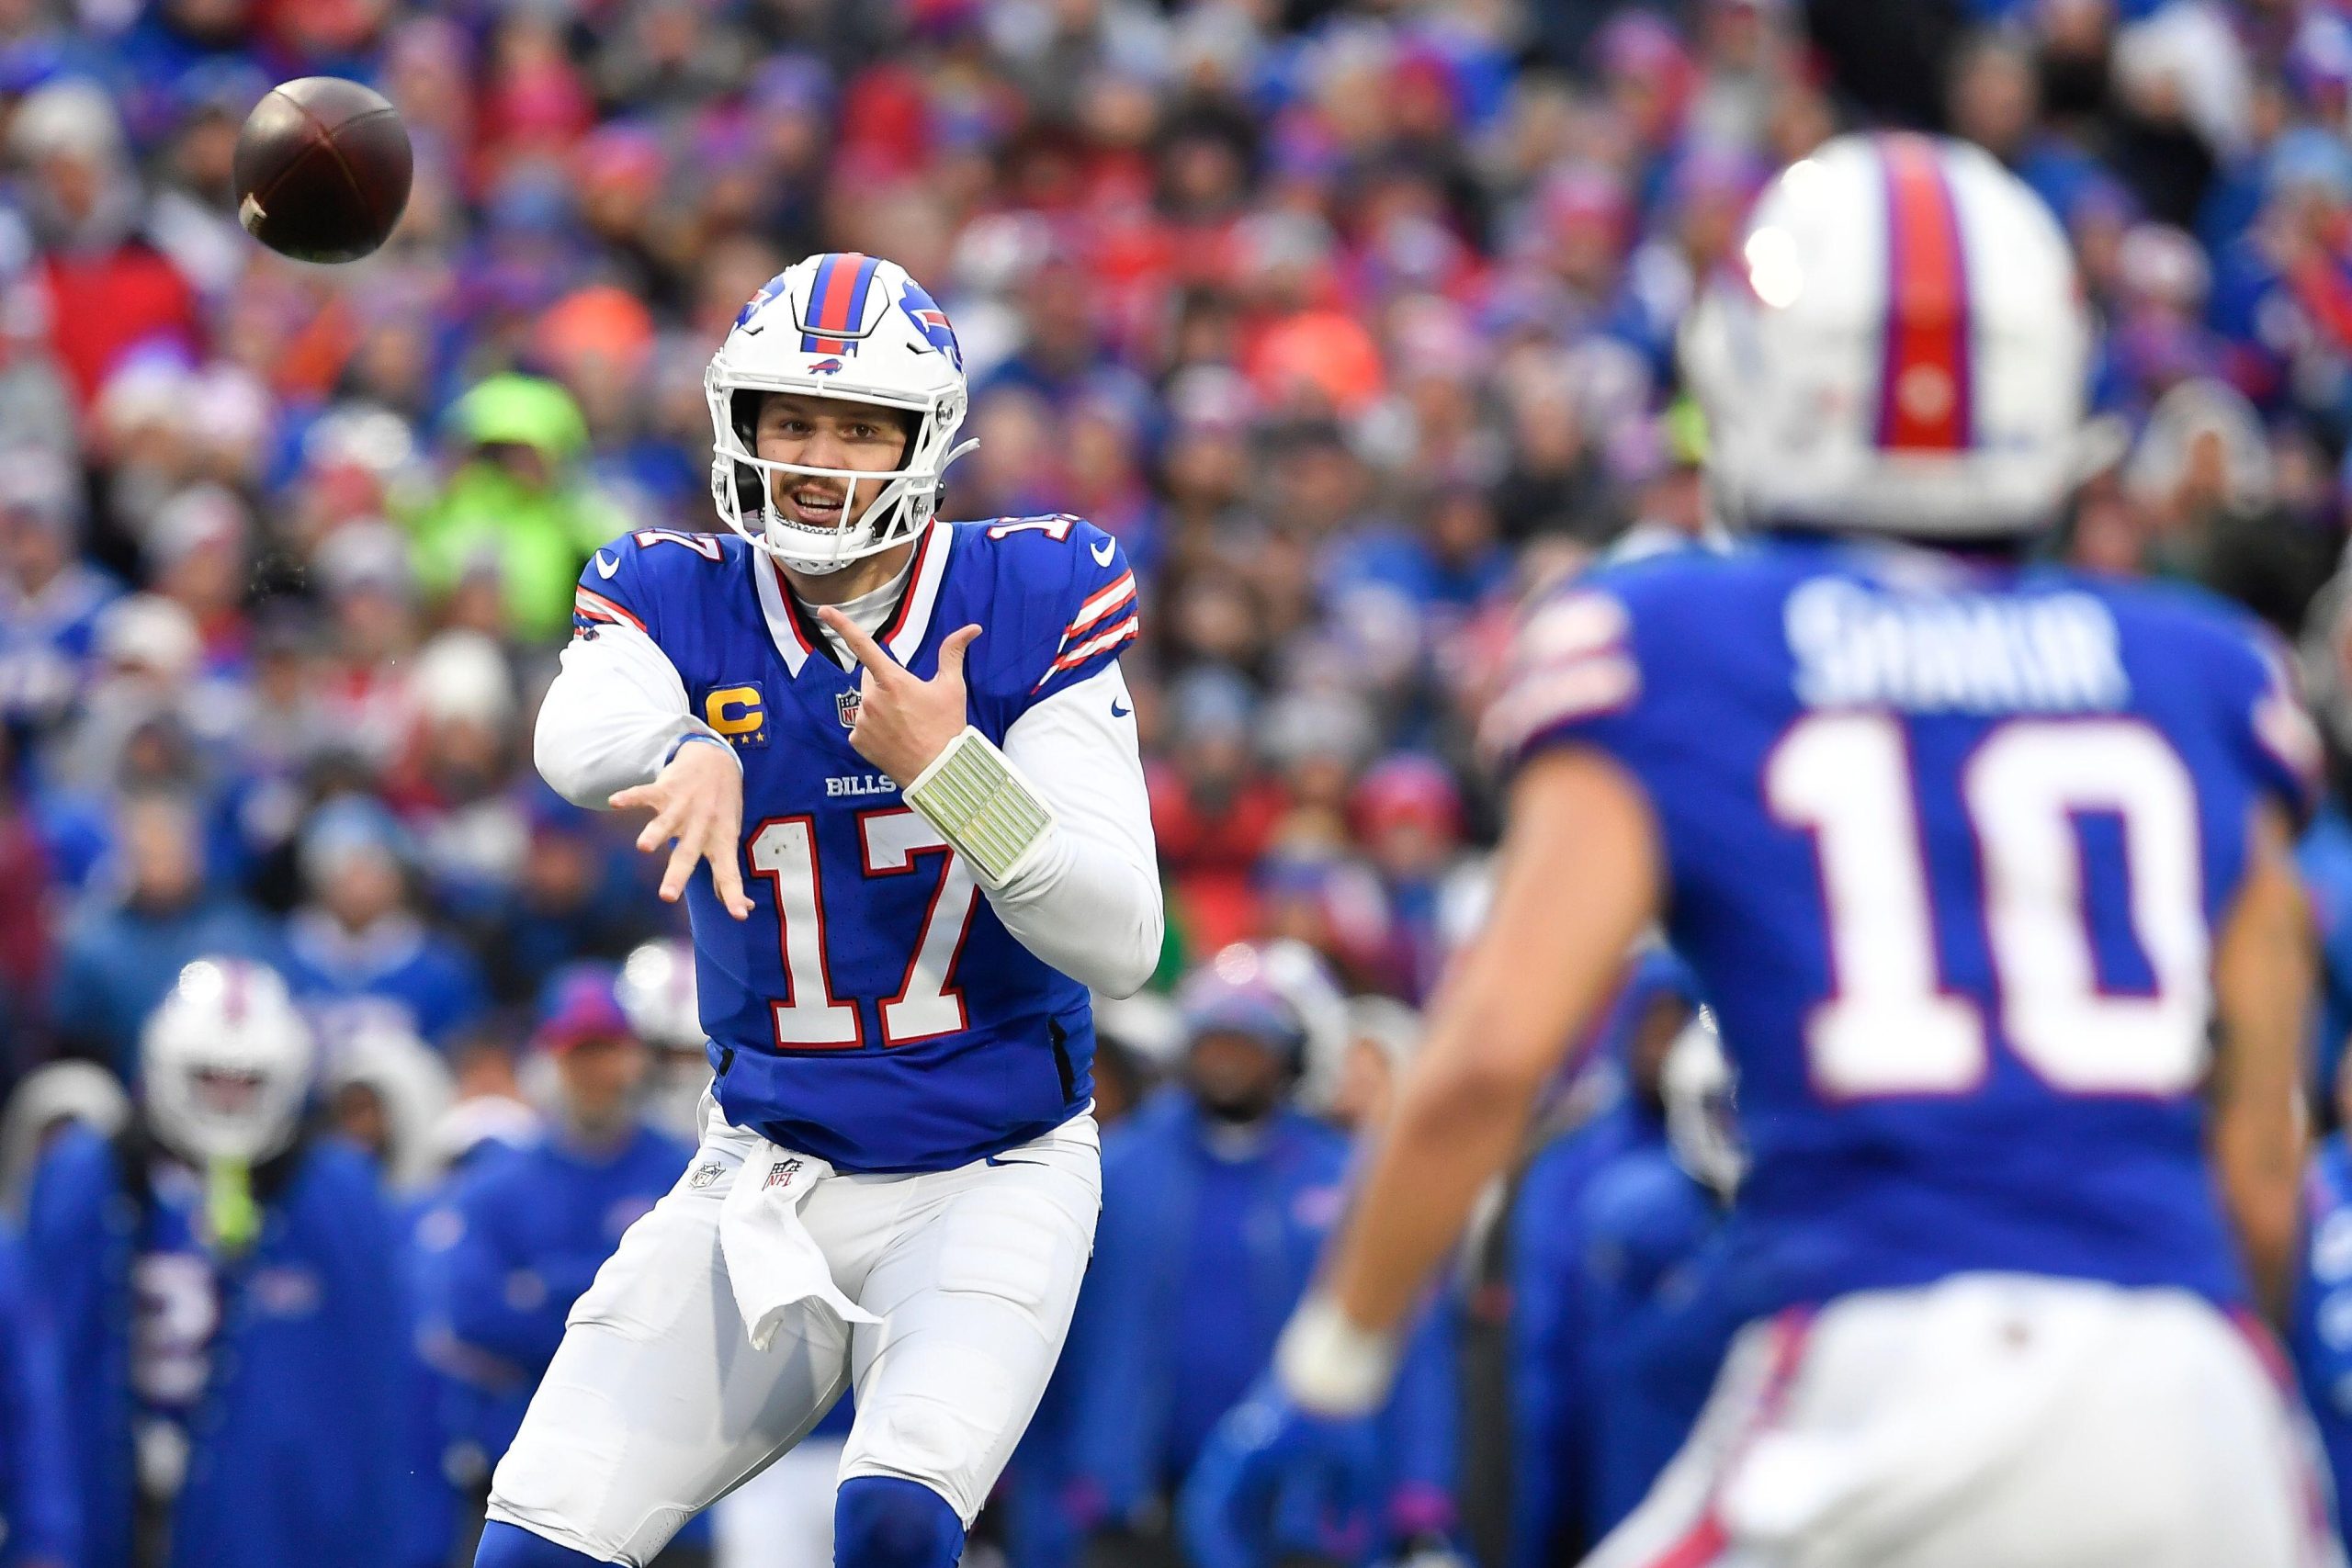
The Buffalo Bills traded Stefon Diggs this offseason, leaving their receiver thin on top-tier talent.
Thu, 16 May 24 11:45:43 +0000
A way-too-early look at four wide receivers with an average draft position (ADP) in Round 6 or later who have the potential to lead their team in targets during the 2024 season.
Thu, 16 May 24 09:30:44 +0000
The Arizona Cardinals made Marvin Harrison Jr. the first wide receiver selection in the 2024 NFL Draft, and he has a chance to take on a significant workload in Year 1.
Thu, 16 May 24 09:15:58 +0000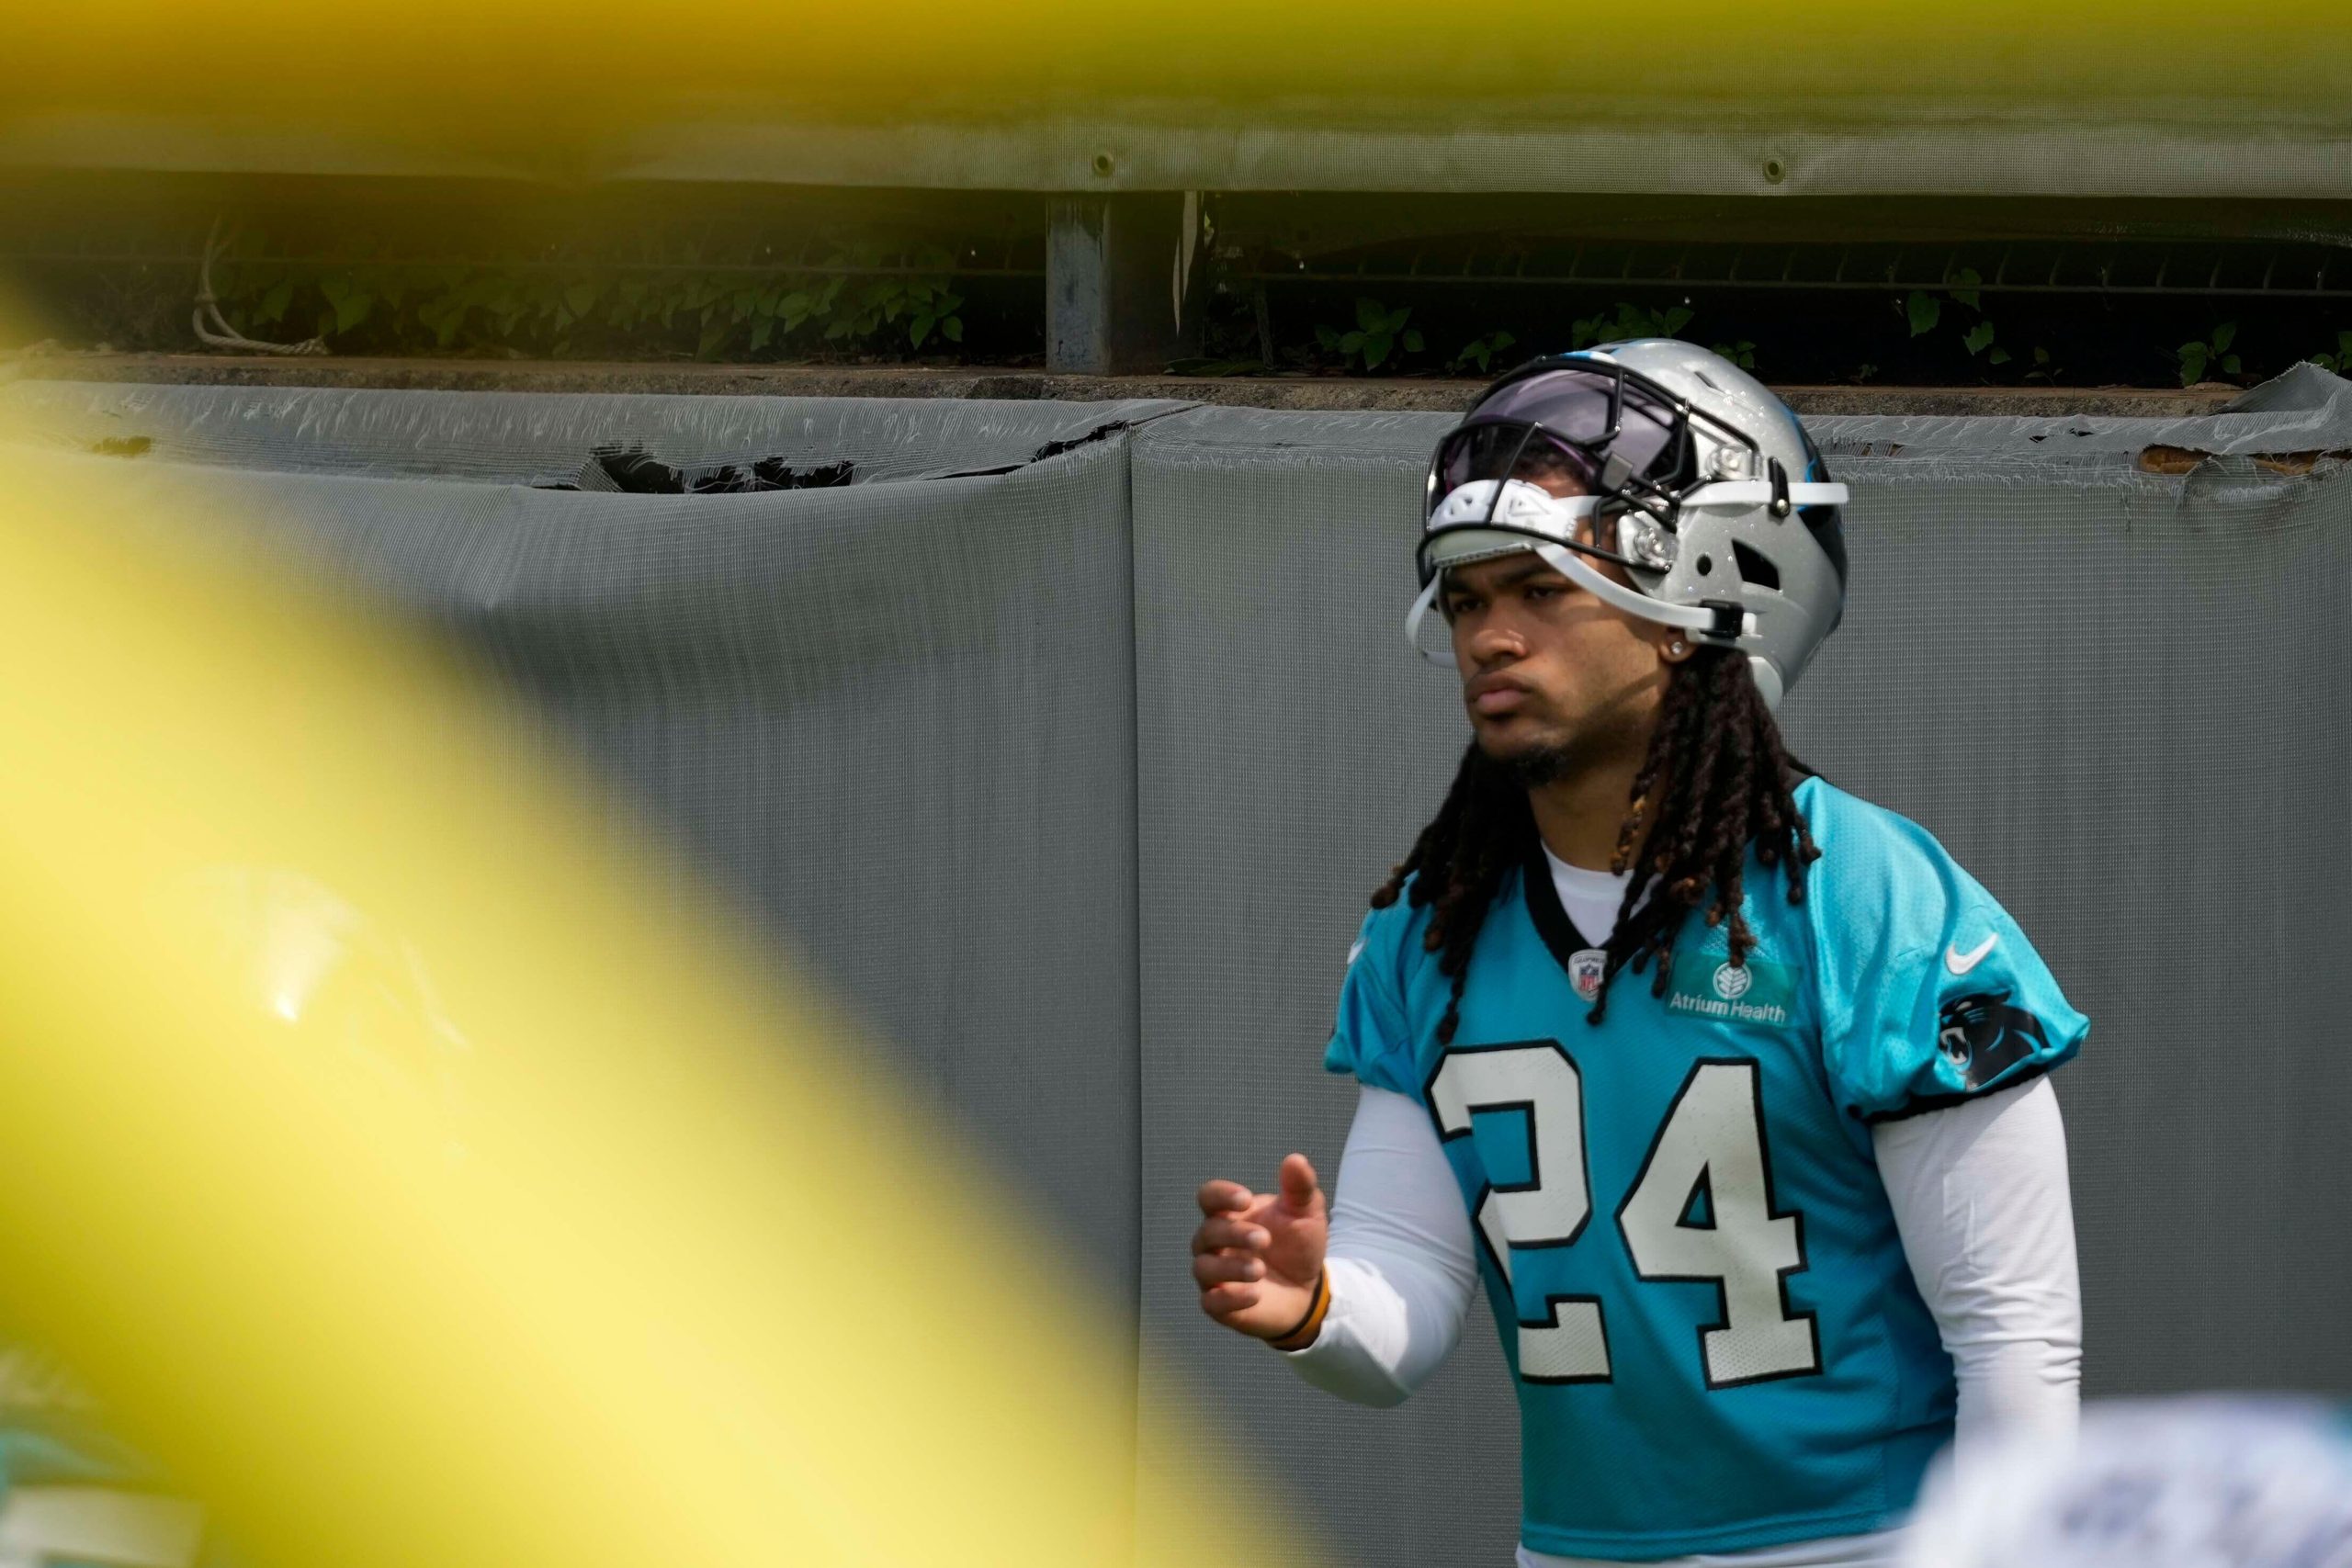
Highly drafted rookies don't always get the chance to start and produce in the NFL. Here are six 2024 rookies for whom that could be the case.
Thu, 16 May 24 09:00:05 +0000
16 potential breakout candidates from the NFC, including Dallas Cowboys linebacker DeMarvion Overshown and Lions receiver Kalif Raymond.
Wed, 15 May 24 12:52:32 +0000
Kate Magdziuk breaks down four players in make-or-break seasons in fantasy football this year.
Wed, 15 May 24 10:30:00 +0000
Ranking the six first-round quarterbacks based on the situation they were drafted into.
Wed, 15 May 24 09:45:59 +0000
Nic Bodiford breaks down the best values in Rounds 4-10 on Underdog Fantasy.
Wed, 15 May 24 09:30:38 +0000
Jon Macri runs through a fantasy football mock draft for the rookie class in dynasty leagues.
Wed, 15 May 24 09:15:17 +0000
Max Chadwick details the 10 interior offensive linemen to know ahead of the 2025 NFL Draft.
Wed, 15 May 24 09:00:55 +0000
Jared Goff is a very good quarterback, but now the Lions -- one of the best-run franchises in recent years -- will have to continue to do outstanding work with the difficulty setting set just a little bit higher.
Tue, 14 May 24 15:28:40 +0000
Quarterback Luis Perez and edge defender Vic Beasley Jr. headline PFF's UFL Week 7 Team of the Week.
Tue, 14 May 24 09:45:07 +0000-
Our exclusive database, featuring the most in-depth collection of NFL player performance data.
Available with
Every NFL Team
Who do you cheer for? PFF grades every player in every game for every team. Dive deep into your fandom and follow your team on PFF for exclusive team stats and NFL team rankings.
AFC East
AFC North
AFC South
AFC West
NFC East
NFC North
NFC South
NFC West
PFF Football News & Analysis
PFF analyzes every player and every play of every game to deliver player grades, stats, and rankings for the NFL, fantasy football, and NFL Draft.
